
|
Fig. 4
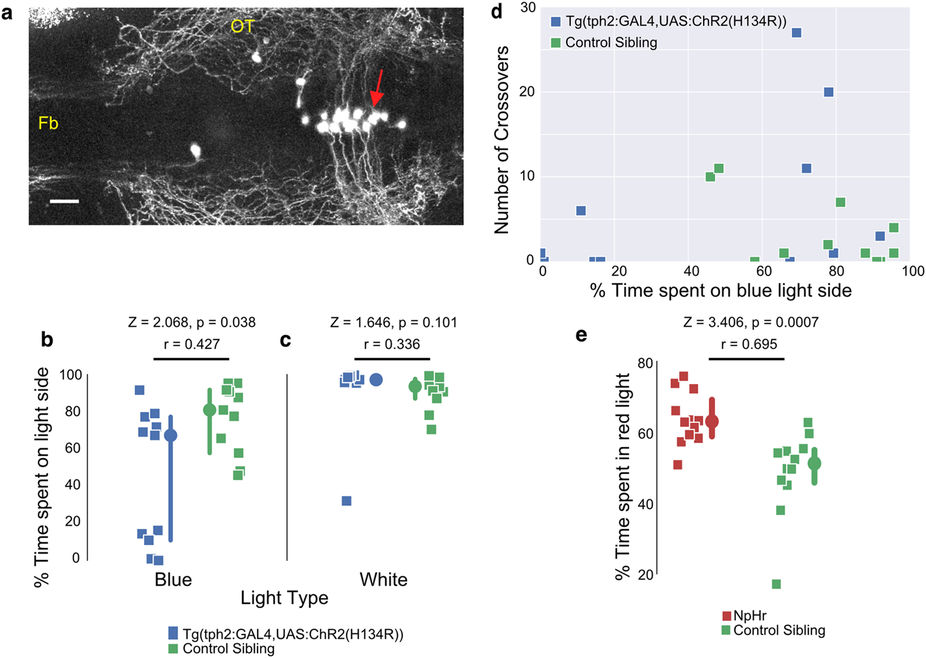
Effect of optogenetic manipulation of tph2 neurons on preference.
(a) Dorsal view of a Tg(tph2:GAL4, UAS:ChR2(H124R)-eYFP) larva, with anterior to the left. Channelrhodopsin is expressed in the dorsal raphe (red arrow). The image is a maximal projection of optical sections covering 122 μm. (b,c) The percentage of time spent in the light side of the tank, with either blue (b) or white (c) light. All control sibling fish preferred the side with blue or white light. However, fish expressing ChR2 (H134R)-eYFP under the tph2 driver had a significant preference for the dark side when blue light was used. (d) The number of crossovers between the blue light and the dark side as a function of their percentage of time spent on the blue light side. (e) Preference of eNpHR3.0-expressing fish and their siblings for red over green (n = 12 each). There is a significant change towards red in fish expressing halorhodopsin (p = 0.0007). Fb: forebrain; OT: optic tectum; scale bar = 25 μm. Gamma = 0.65 was applied to panel (a). In panels c and e, each square represents one fish (n = 11 fish in each group). Circles are the median and error bar indicates 95% c.i. around the median. p-value is obtained from Wilcoxon Rank-sum test. Z is the test statistic; r is the non-parametric effect size.