
|
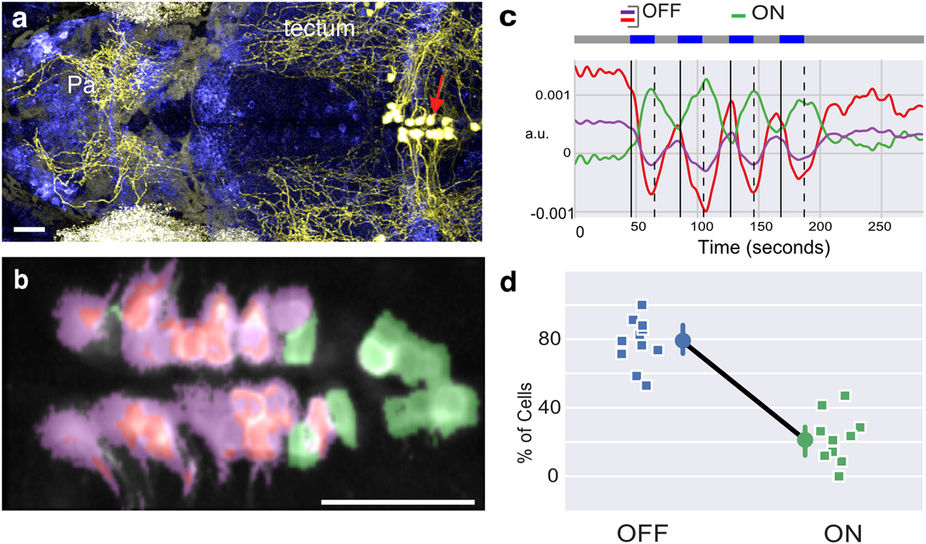
Fig. 2
Response of dorsal raphe serotonergic neurons to light and darkness.
(a) Serotonergic neurons (red arrow) in the dorsal raphe of a 5 day-old zebrafish, as labelled by Kaede (coloured yellow) in a Tg(tph2:GAL4, UAS:Kaede) line. Axons extend broadly in the brain, which is pan-neurally labelled (blue). (b) Activity in the raphe of a 9 day-old Tg(tph2:GCaMP6s) fish, in response to four pulses of light. Pixels have the same color scheme as the activity profiles shown in panel c (see Methods). (c) Time series of three clusters obtained by running k-means clustering following principal component analysis (PCA) with two components on the data in panel (b). Blue light was delivered during the periods indicated by the blue bars. (d) Average percentage of tph2 neurons in the raphe excited (ON neurons) or inhibited (OFF neurons) by light (n = 11 fish; squares are individual fish, circles indicate mean and error bar indicates 95% c.i. around the mean). Anterior is to the left in panels (a,b) Pa: pallium; scale bar = 25 μm.