
|
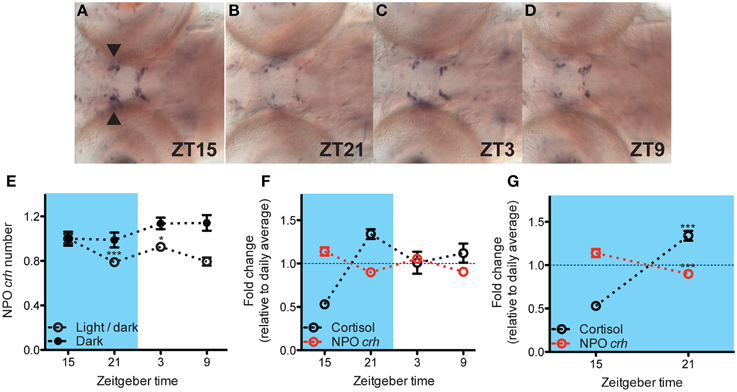
Fig. 2
Negative correlation between NPO crh and cortisol level under basal condition. (A–D) Representative crh in situ pictures at 4 different time points. NPO crh mRNA positive cells (arrowhead) at different time were quantified. (E) The NPO crh shows a daily variation which is abolished by light deprivation (N = 23–24) (F) Daily variations of NPO crh and cortisol level showed reversed patterns. NPO crh and cortisol were plotted together after normalized to their daily average which was set to 1 respectively (Cortisol: N = 12; NPO crh: N = 23–24). (G) Negative correlation can be detected between NPO crh cell number and cortisol level when cortisol rises from its nadir to peak level (data from G). *p < 0.05 and ***p < 0.001.