
Image
|
Figure Caption
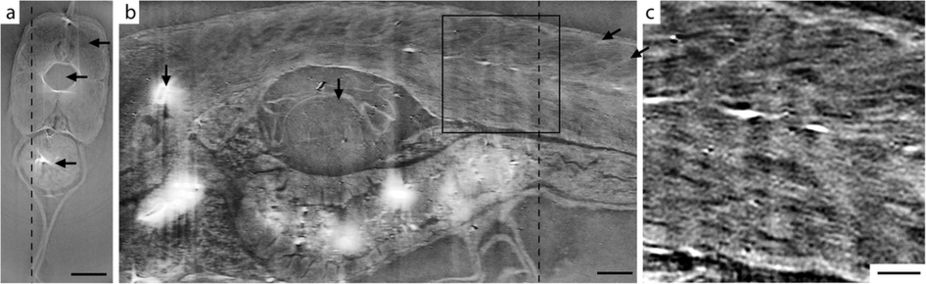
Fig. 2
Phase-contrast tomography of 20 dpf healthy zebrafish.
(a) Axial slice, corresponding to the dashed line through (b). Arrows indicate (from top) muscle tissue, notochord, and stomach. Scale bar is 100 μm. (b) Sagittal slice, corresponding to the dashed line through (a). The myofibril pattern is clearly visible. The arrows (from left) indicate bone, swim bladder and two myosepta. The scale bar is 100 μm. (c) Enlargement of the boxed area in (b). Scale bar is 50 μm.
Acknowledgments
This image is the copyrighted work of the attributed author or publisher, and
ZFIN has permission only to display this image to its users.
Additional permissions should be obtained from the applicable author or publisher of the image.
Full text @ Sci. Rep.