
Image
|
Figure Caption
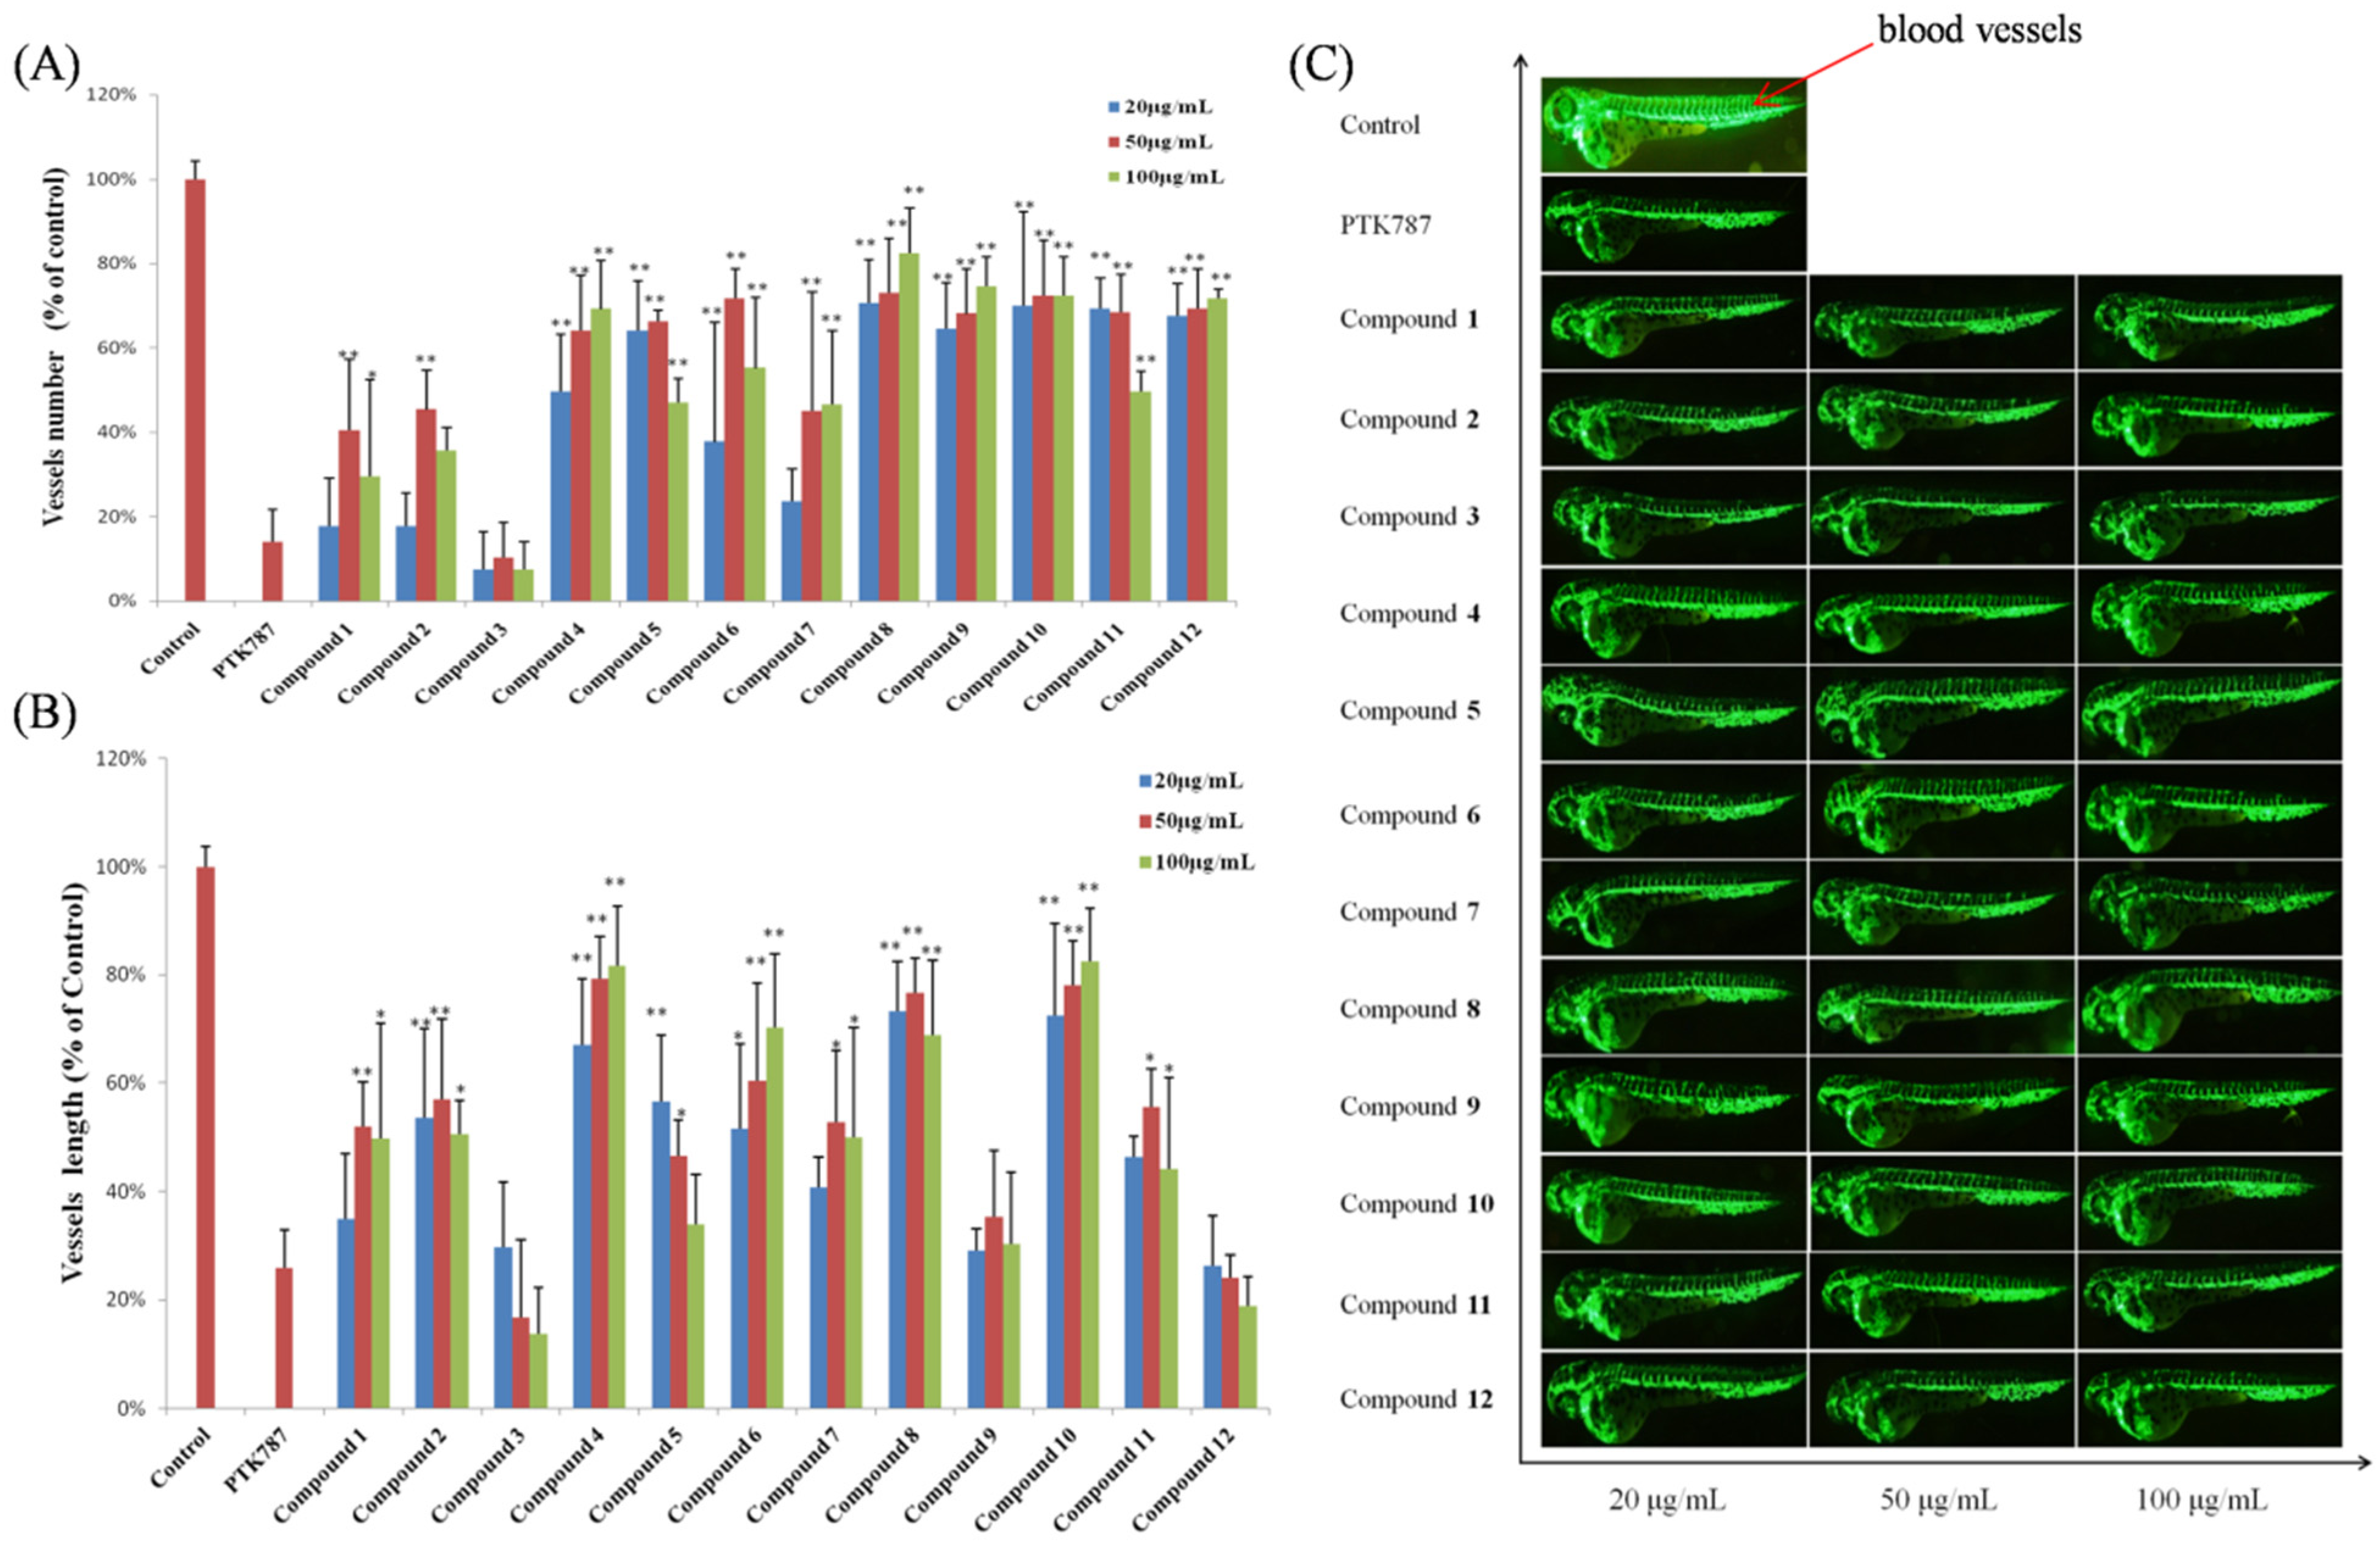
Fig. 9
Results of vasculogenesis experiments. (A) Number of vessels in zebrafish treated with 12 compounds in the vasculogenesis experiments; (B) vessel length of zebrafish treated with 12 compounds in the vasculogenesis experiments; (C) representative images of zebrafish treated with 12 compounds in the vasculogenesis experiments (blood vessels are shown as red arrows). Significant difference between compound treatment and PTK787 (* p < 0.05; ** p < 0.01). The 1‰ DMSO-treated group is represented as “Control”.