
|
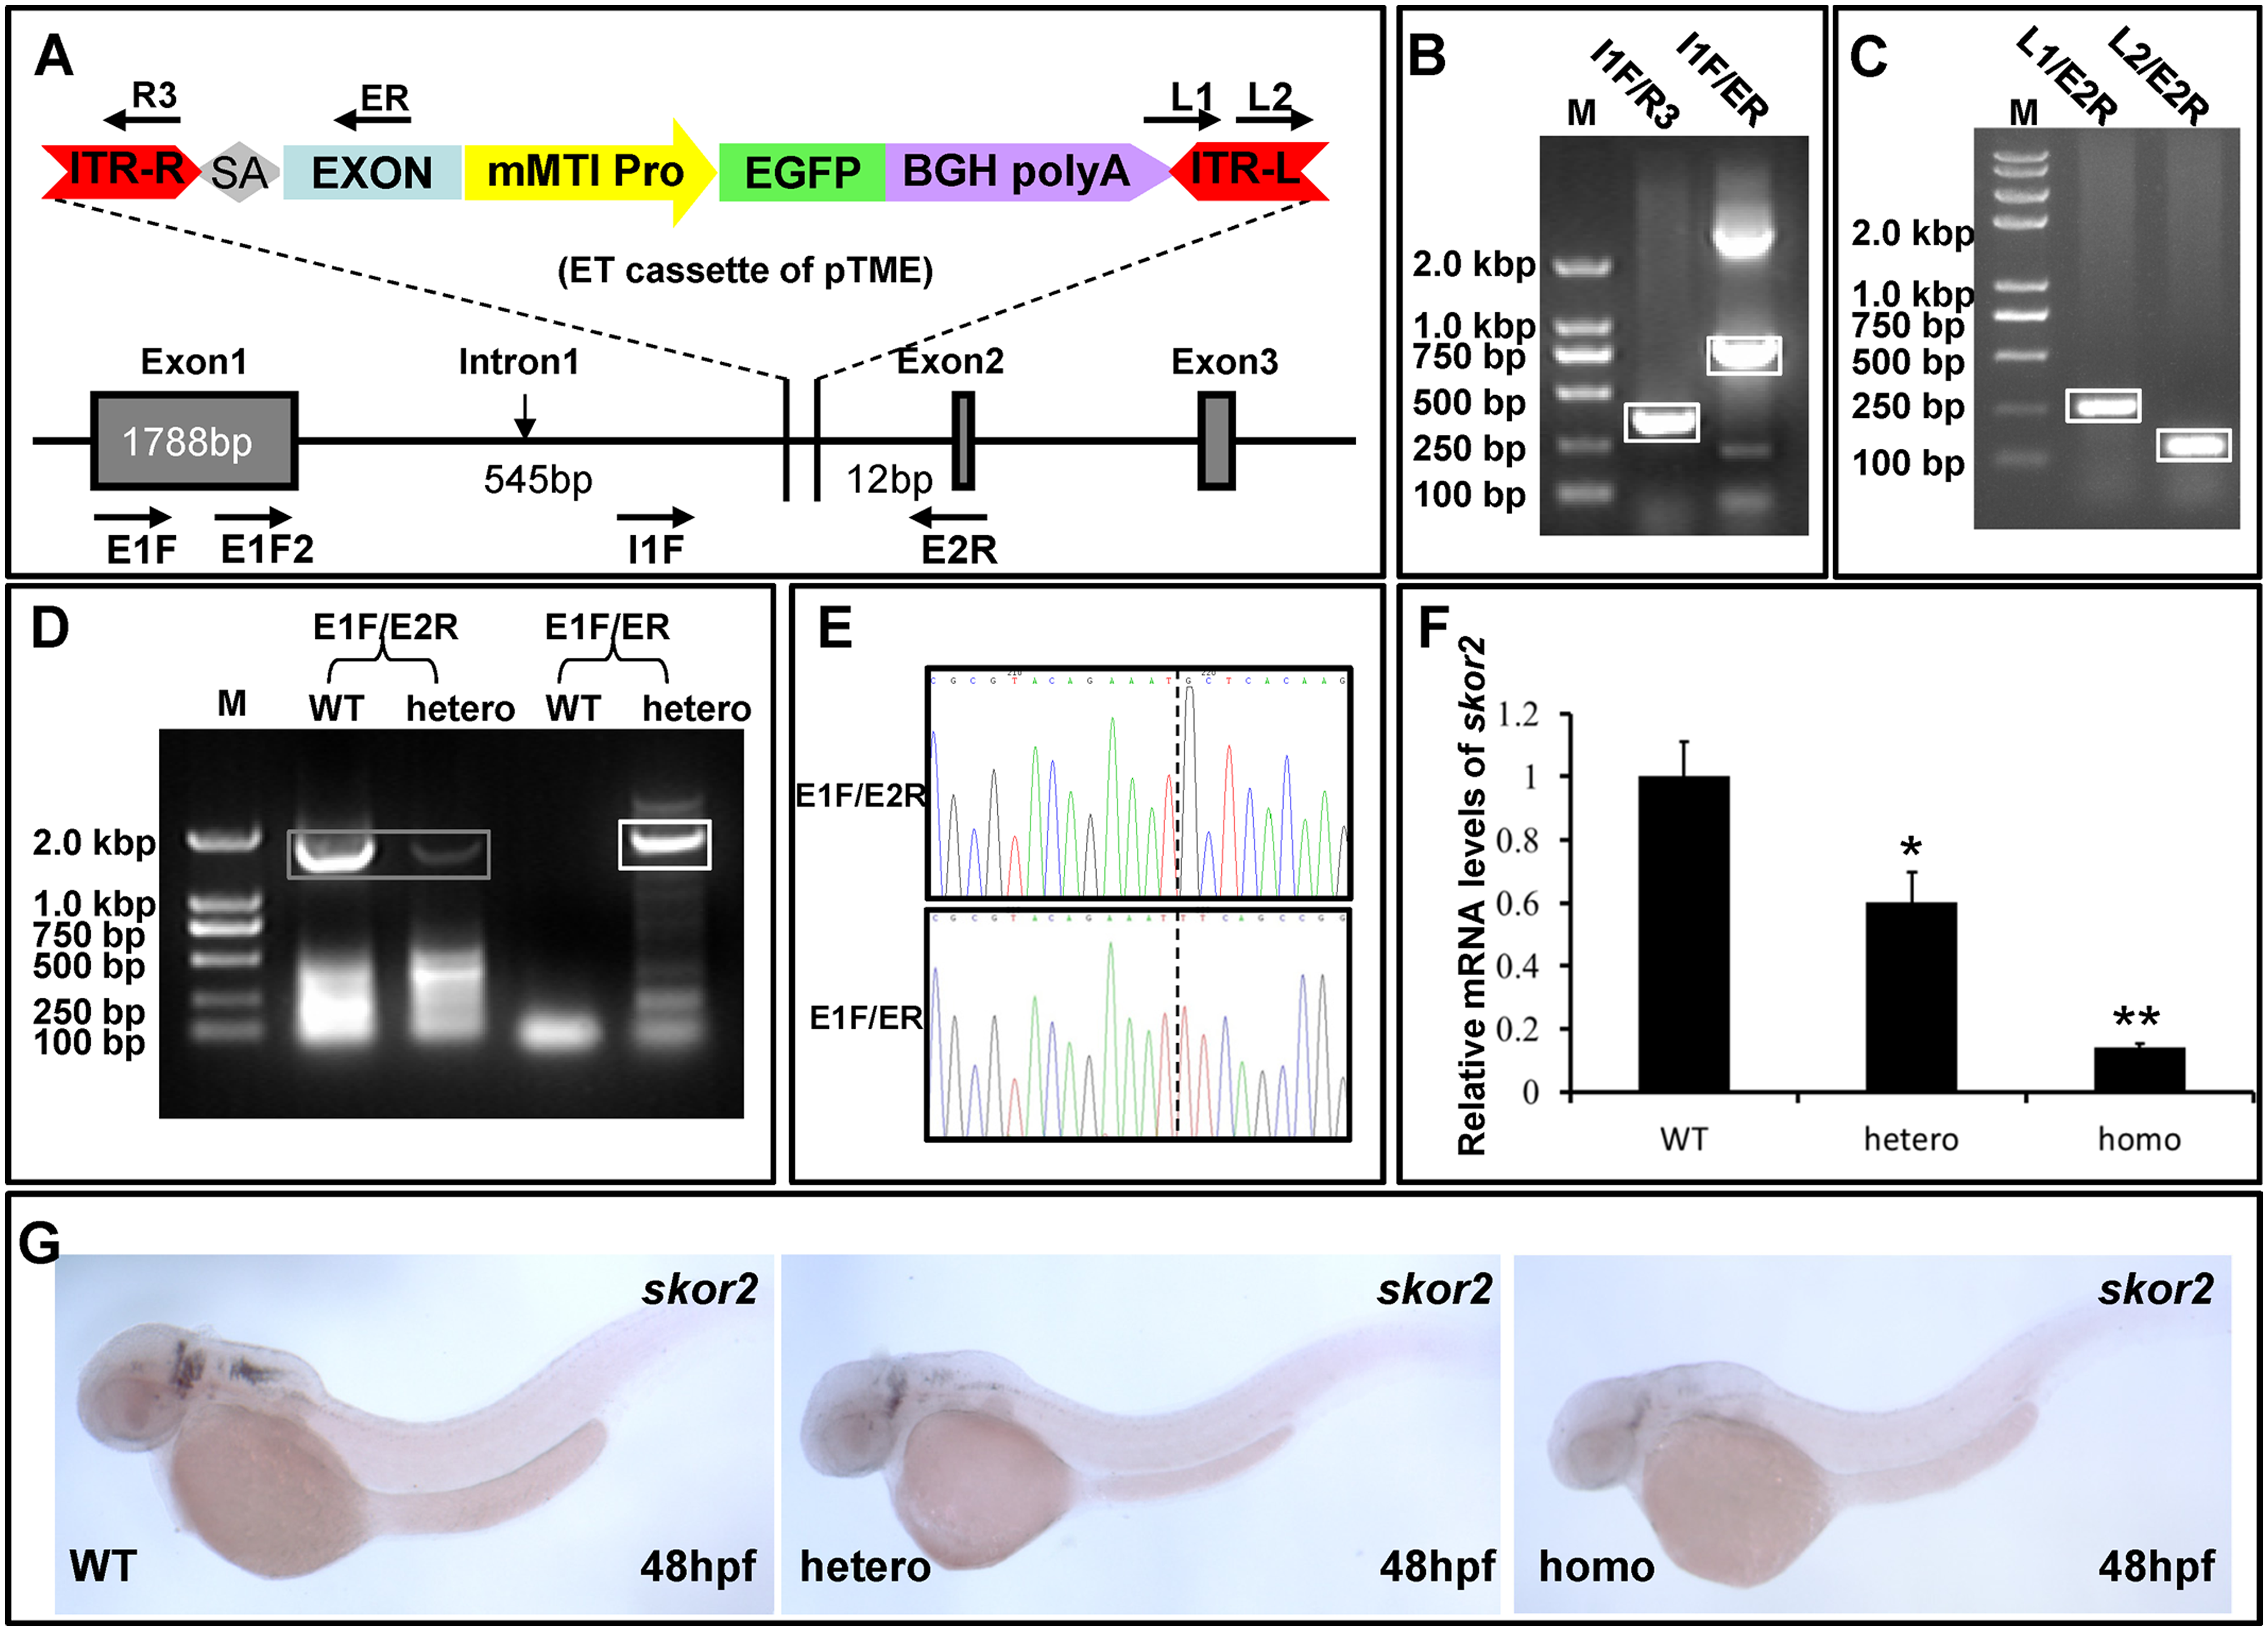
Fig. 7
Insertion mutagenesis of gene skor2 in a transgenic fish line.
(A) A schematic representation of ET cassette inserted into the intron 1 of skor2 gene. (B and C) Integrity analysis of ET cassette at the integration site by PCR using primers as indicated in (A). Boxed DNA bands (B and C) were separated and sequenced. (D) RT-PCR analysis of endogenous skor2 and fusion transcripts in WT and heterozygous (hetero). Primer pairs E1F/E2R were used for amplification of endogenous skor2 transcripts and E1F/ER for exon1-exon fusion transcripts. Two 1840-bp PCR products (boxed) were amplified with primer pairs E1F/E2R and represent a fragment of endogenous transcripts. A single 1856-bp PCR product (boxed) was amplified from heterozygous cDNA. (E) Sequencing data indicate the E1F/ER PCR product in (D) is a fusion transcript of skor2 exon1 and a partial exon in pTME vector. Dotted line indicates the fusion position. (F) qRT-PCR was performed with primer E1F2/E2R to determine the expression of endogenous skor2 gene in WT, heterozygous (hetero) and homozygous (homo) embryos at 48 hpf. The skor2 expression levels were normalized to the β-actin levels. (G) WISH with skor2 probes to detect the endogenous skor2 mRNA expression in WT, heterozygous and homozygous embryos at 48 hpf.