
|
Fig. 4
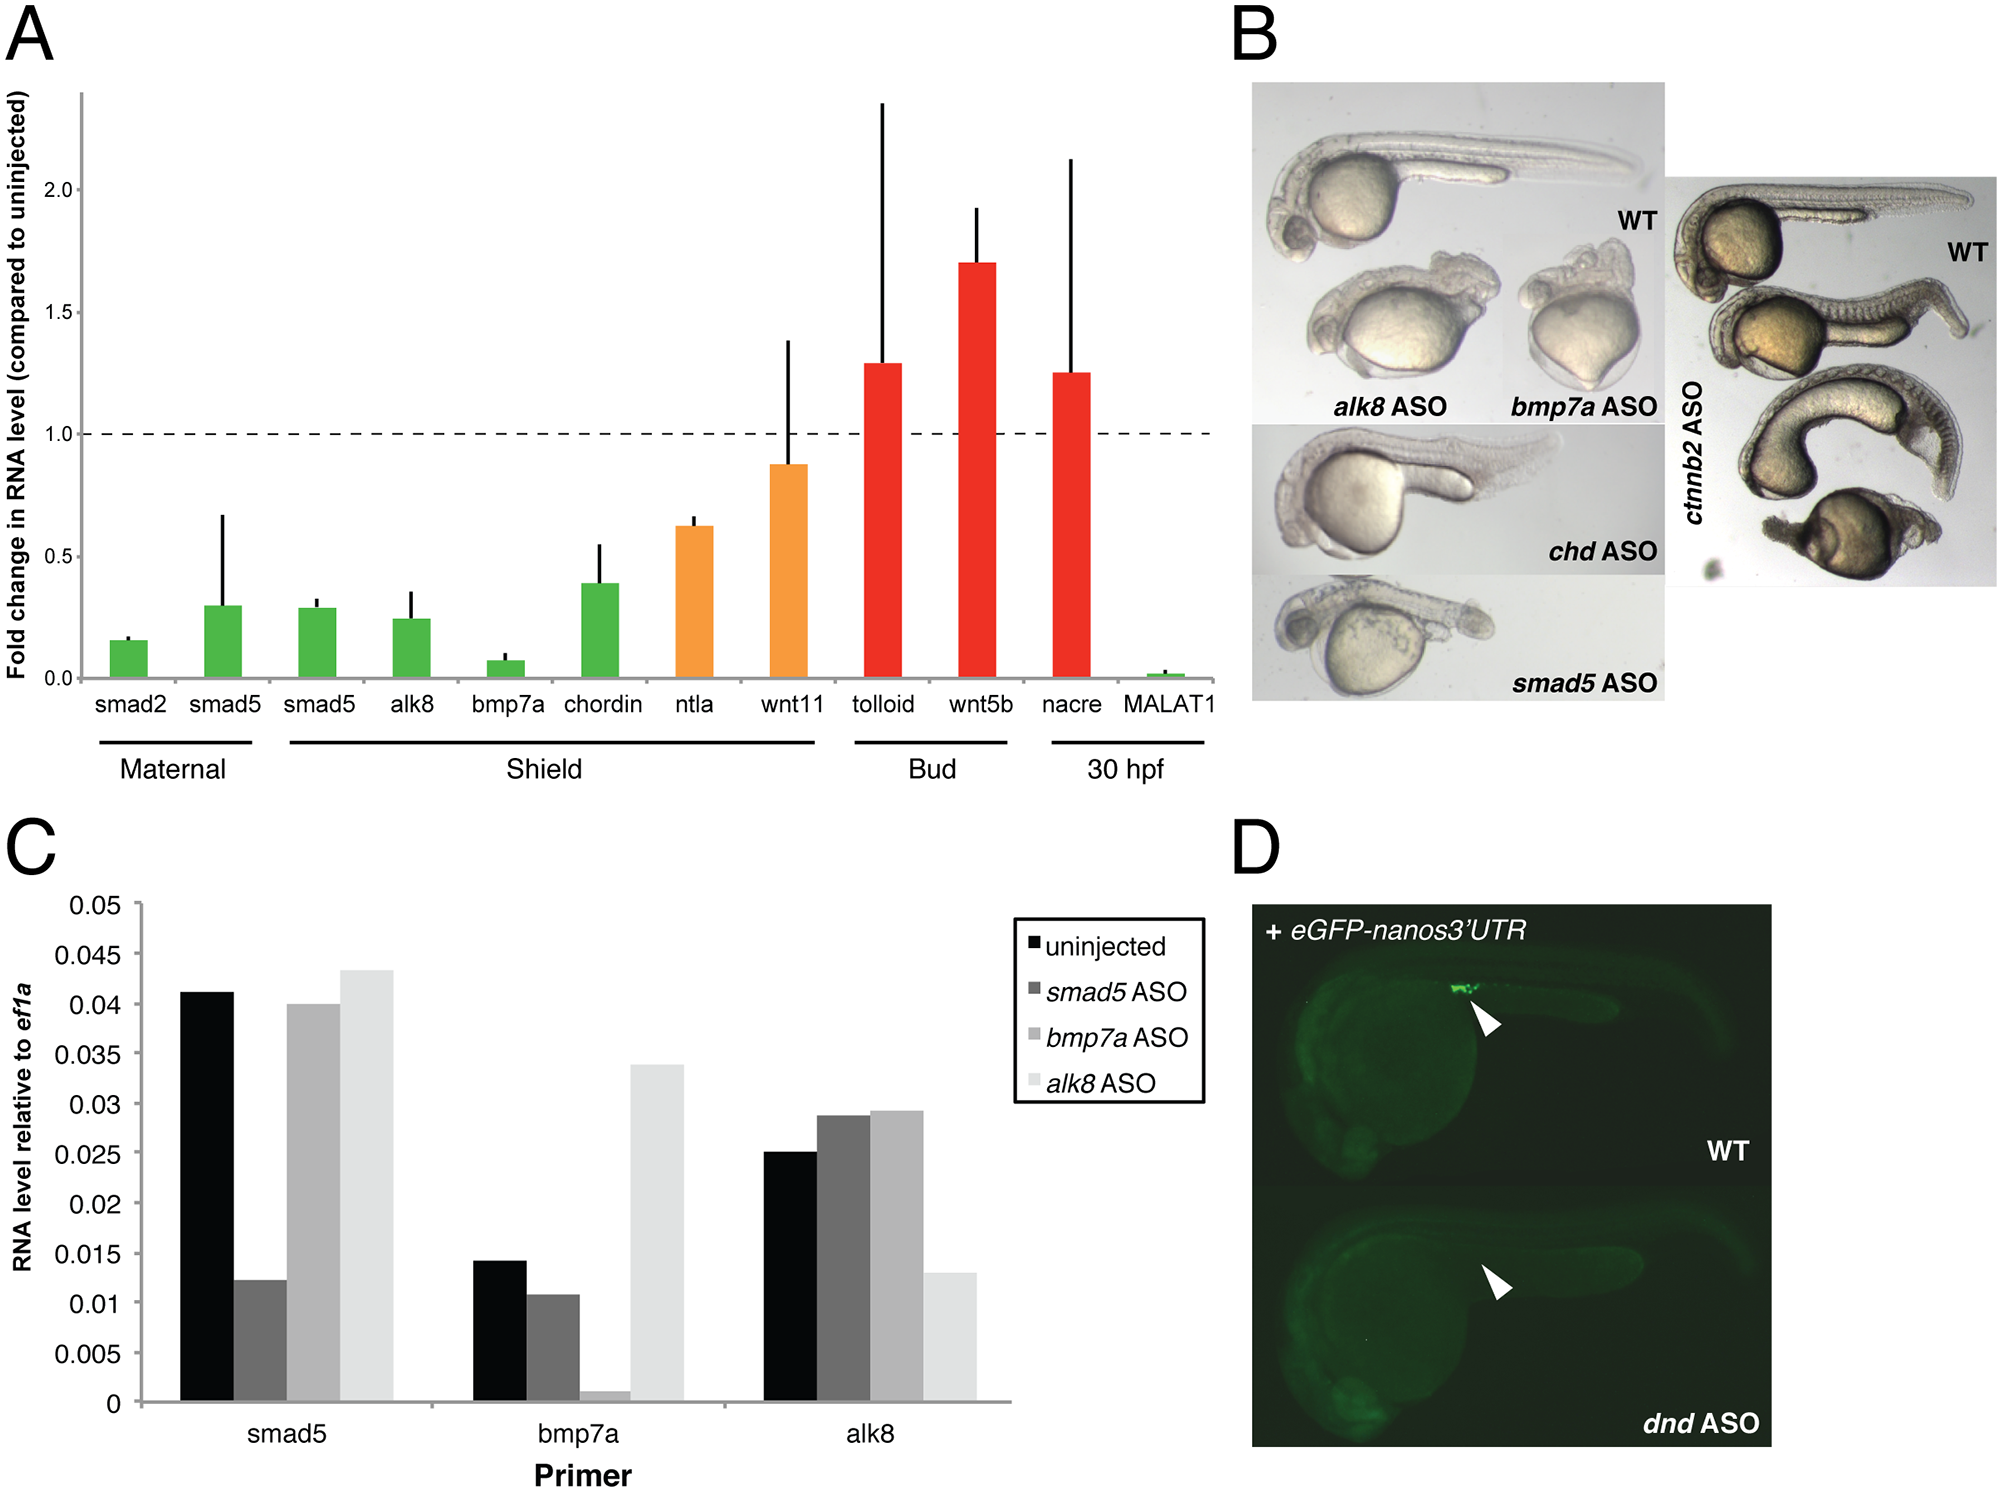
ASO-mediated RNA knockdown correlates with phenotype.
A) The RNA level of the gene corresponding to each ASO was measured (compared to WT, normalized to ef1a) and correlated to the presence of a phenotype: green = reproduced published phenotype (in case of MALAT1: no mutant phenotype), orange = reproduced published phenotype in a smaller percentage of embryos, red = did not produce a phenotype. Injected amount of ASO per embryo: 50 pg smad2 ASO, 50 pg smad5 ASO, 50 pg alk8 ASO, 50 pg bmp7a ASO, 150 pg chordin ASO, 100 pg ntla ASO, 50 pg wnt11 ASO, 150 pg tolloid ASO, 100 pg wnt5b ASO, 100 pg nacre ASO, 150 pg MALAT1 ASO. Error bars show standard deviation of the mean of 2 independent experiments (10 embryos each). B) ASO-generated phenotypes for alk8, bmp7a, chordin, smad5 and ctnnb2 (shown are 3 embryos representative of the different severities of ctnnb2 ASO-induced phenotypes). C) ASOs only target the cognate RNA, and not unrelated RNAs. qPCR-based assessment of ASO specificity to their cognate target genes (10 embryos each). D) dnd ASOs block germ cell formation. Germ cells were labeled by injection of 80 pg eGFP-nanos3’UTR mRNA. Coinjection of 25 pg dnd ASO caused complete loss of green germ cells (white arrow).