
|
Fig. 3
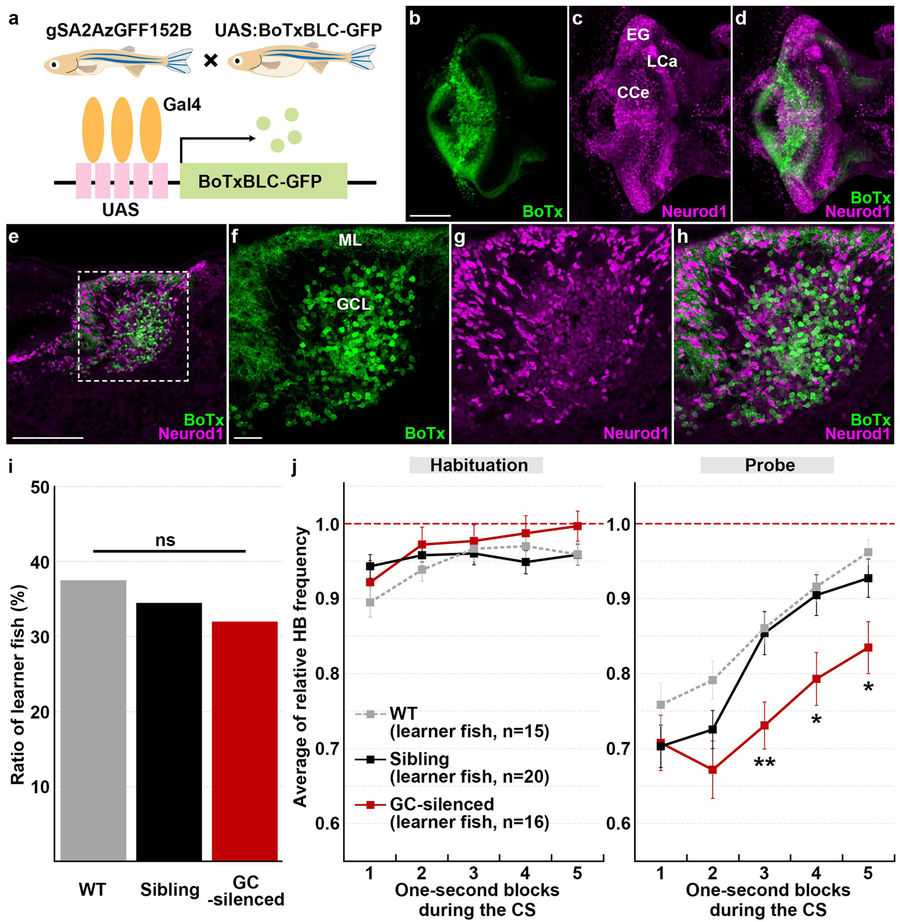
Granule-cell inhibition prolonged conditioned fear responses. (a) Schematic of granule-cell inhibition. Tg larvae with inhibited granule-cell activity (GC-silenced larvae) were obtained by crossing the granule-cell-specific Gal4 line gSA2AzGFF152B and the Tg(UAS:BoTxBLC-GFP) line, which expresses a fusion protein of GFP and the light chain of botulinum toxin light B (BoTxBLC-GFP) in a Gal4-dependent manner. (b–h) BoTxBLC-GFP expression in 20-dpf GC-silenced larvae. Immunostaining of the brain (whole-mount, b–d) and sagittal sections (e–h) with anti-GFP (green) and Neurod1 (magenta) antibodies, showing the cerebellar regions. Dorsal views with anterior to the left. (f–h) Higher magnification views of the dotted box in (e). Neurod1 signals mark granule-cell nuclei. About a half of the mature granule cells in the CCe (located in the granule-cell layer) expressed BoTxBLC-GFP in the GC-silenced larvae (Supplementary Fig. S3, Table S1). Scale bars: 100 μm in (b) (applied to c,d); 100 μm in (e); 20 μm in (f) (applied to g,h). GCL, granule-cell layer; ML, molecular layer (see Fig. 1 for other abbreviations). (i) Percentage of fish showing CS-dependent bradycardia (learner fish); 15 of the 40 wild-type (WT) larvae were learners, 16 of the 50 GC-silenced larvae were learners, and 20 of the 58 sibling GFP-negative larvae were learners. There was no significant difference in the learner rate among wild-type, the GC-silenced and the sibling groups (P = 0.8615, Fisher’s exact test). ns represents no significance. (j) CS-evoked bradycardia responses in wild-type, the GC-silenced, and their sibling learner fish. Relative HB frequency during 1 s period of the 5 s CS presentation (average of each one-second block) is shown. Average of the data from 10 trials in the habituation and probe sessions was calculated and plotted in graphs. The graphs show the average and standard errors (SE) of the data from wild-type larvae (n = 15, gray dotted), the GC-silenced larvae (n = 16, red), and their sibling larvae (n = 20, black). The CS-evoked bradycardia responses during the probe session differed between the GC-silenced and the sibling learner groups (** represents P < 0.01 and * represents P < 0.05, two-way repeated measures ANOVA with Bonferroni’s post-hoc test). Both the GC-silenced and sibling larvae exhibited bradycardia in response to the CS during the probe session. The bradycardic response of the GC-silenced larvae was prolonged in the probe sessions. Note that the change of relative HB frequency in wild-type learner fish during the habituation and probe sessions was similar to that in the sibling learner fish.