
|
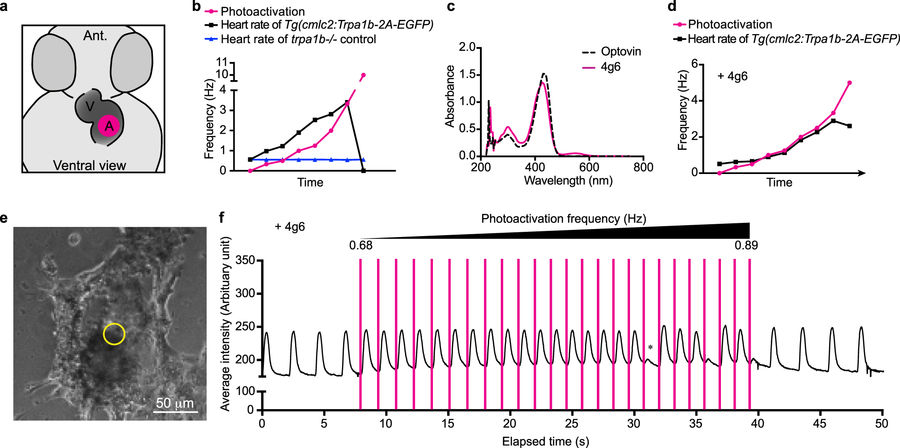
Fig. 5
Optogenetic pacing of zebrafish hearts in vivo and human stem cell-derived cardiomyocytes in vitro. (a) Diagram of zebrafish larval heart. Magenta circle indicates the location of photo-activation. V, ventricle; A, atrium; Ant, anterior. (b) Heart pacing experiment on trpa1b−/− larvae expressing zTrpa1b in the cardiomyocytes at 2 dpf. Heart pacing was performed by photo-activating the atrium of the heart in vivo with violet light. Representative graphs show the change in heart rate for Tg(cmlc:Trpa1b-2A-EGFP) (black line, n = 11, Video S4) or trpa1b−/− control (blue line, n = 7) and the corresponding photo-activation frequency (magenta line) with 10 μM optovin. (c) Absorbance of optovin and 4g6 at the indicated wavelengths. (d) Similar heart pacing experiment as in (e) with 10 μM 4g6 treatment (Video S5; n = 8). (e) Brightfield image of zTRPA1b-expressing human stem cell-derived cardiomyocyte with sub-region indicated for the trace in (f). (f) Mean pixel intensity over time as an index of local contractile-displacement in the presence of 4g6. Photoactivation light pulses are indicated with magenta bar. Asterisk indicates a loss of 1:1 pacing-capture at a high photo-activation frequency (n = 3).