
Image
|
Figure Caption
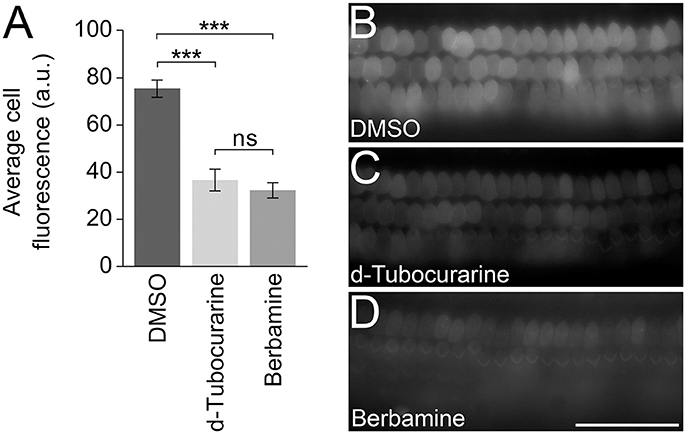
Fig. 11
d-Tubocurarine and berbamine reduce the loading of GTTR. (A) dTC and berbamine significantly reduced the fluorescent intensity of 0.2 μM GTTR compared to DMSO controls (***p < 0.001). No significant difference was seen between the reduction by dTC and berbamine. Fluorescent intensity was measured in arbitrary units (a.u.). Error bars are ±SEM. (B–D) Representative images taken following 10 min GTTR exposure in DMSO, dTC and berbamine. Scale bar = 50 μm.
Acknowledgments
This image is the copyrighted work of the attributed author or publisher, and
ZFIN has permission only to display this image to its users.
Additional permissions should be obtained from the applicable author or publisher of the image.
Full text @ Front. Cell. Neurosci.