
|
Fig. 7
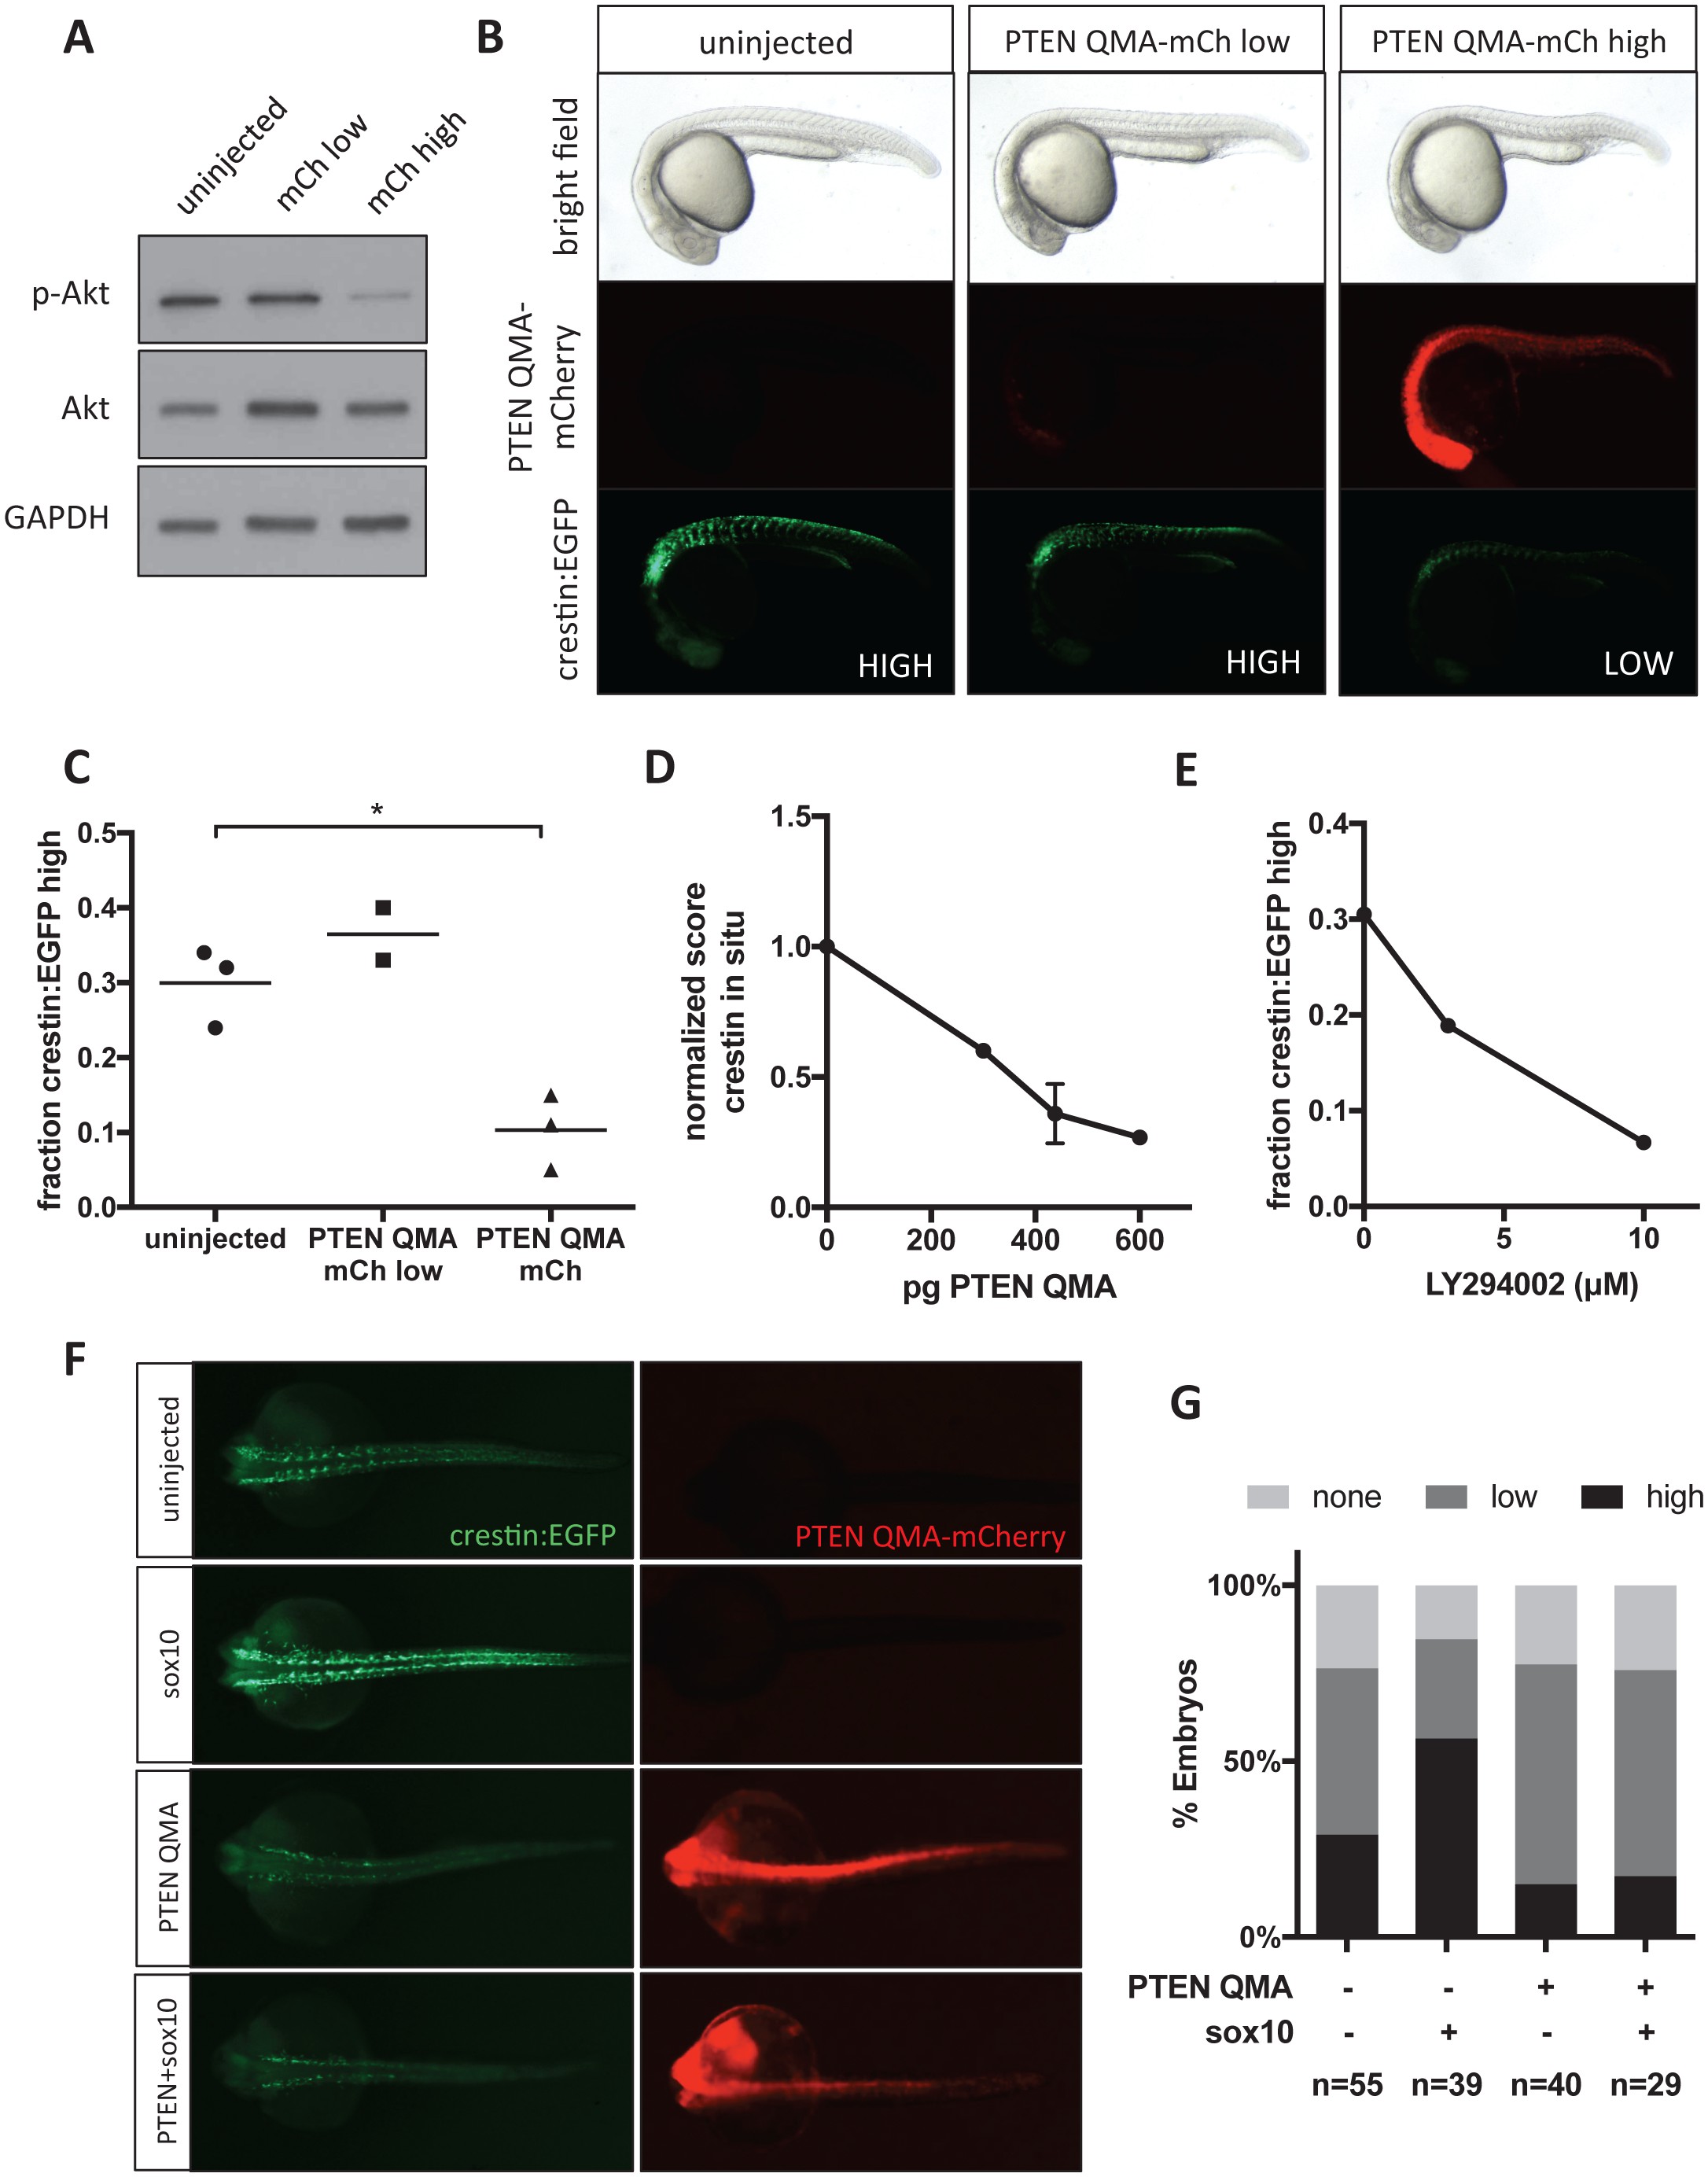
Akt signaling regulates neural crest gene expression in vivo.
(A) PTEN QMA-mCherry (300 pg) reduces phospho-Akt level in whole embryos. (B) Morphology, PTEN QMA-mCherry expression, and crestin:EGFP expression of PTEN QMA-mCherry injected embryos. Scoring system for crestin:EGFP levels is indicated. (C) Quantification based on scoring in (B). Each point represents a single clutch (5–53 embryos per condition), and mean is indicated. One clutch generated less than 5 PTEN QMA-mCherry low embryos and is not shown. *p<0.01, Student’s t-test (D) PTEN QMA-mCherry decreases crestin expression by ISH. Embryos were scored as in Figure 5B. Average score normalized to uninjected control is indicated. Error bars represent SEM of four clutches (7–28 embryos per condition) from three independent experiments. One clutch was excluded because of abnormally low staining in both control and injected embryos. (E) The PI3K inhibitor LY294002 decreases crestin:EGFP expression. Points indicate the average of two independent experiments. (F) PTEN QMA-mCherry prevents Sox10 from stimulating crestin:EGFP expression. Representative embryos from the same clutch are shown. (G) Three clutches (8–19 embryos per condition) from two independent experiments were scored as in (B).