
Image
|
Figure Caption
Fig. 4 S2
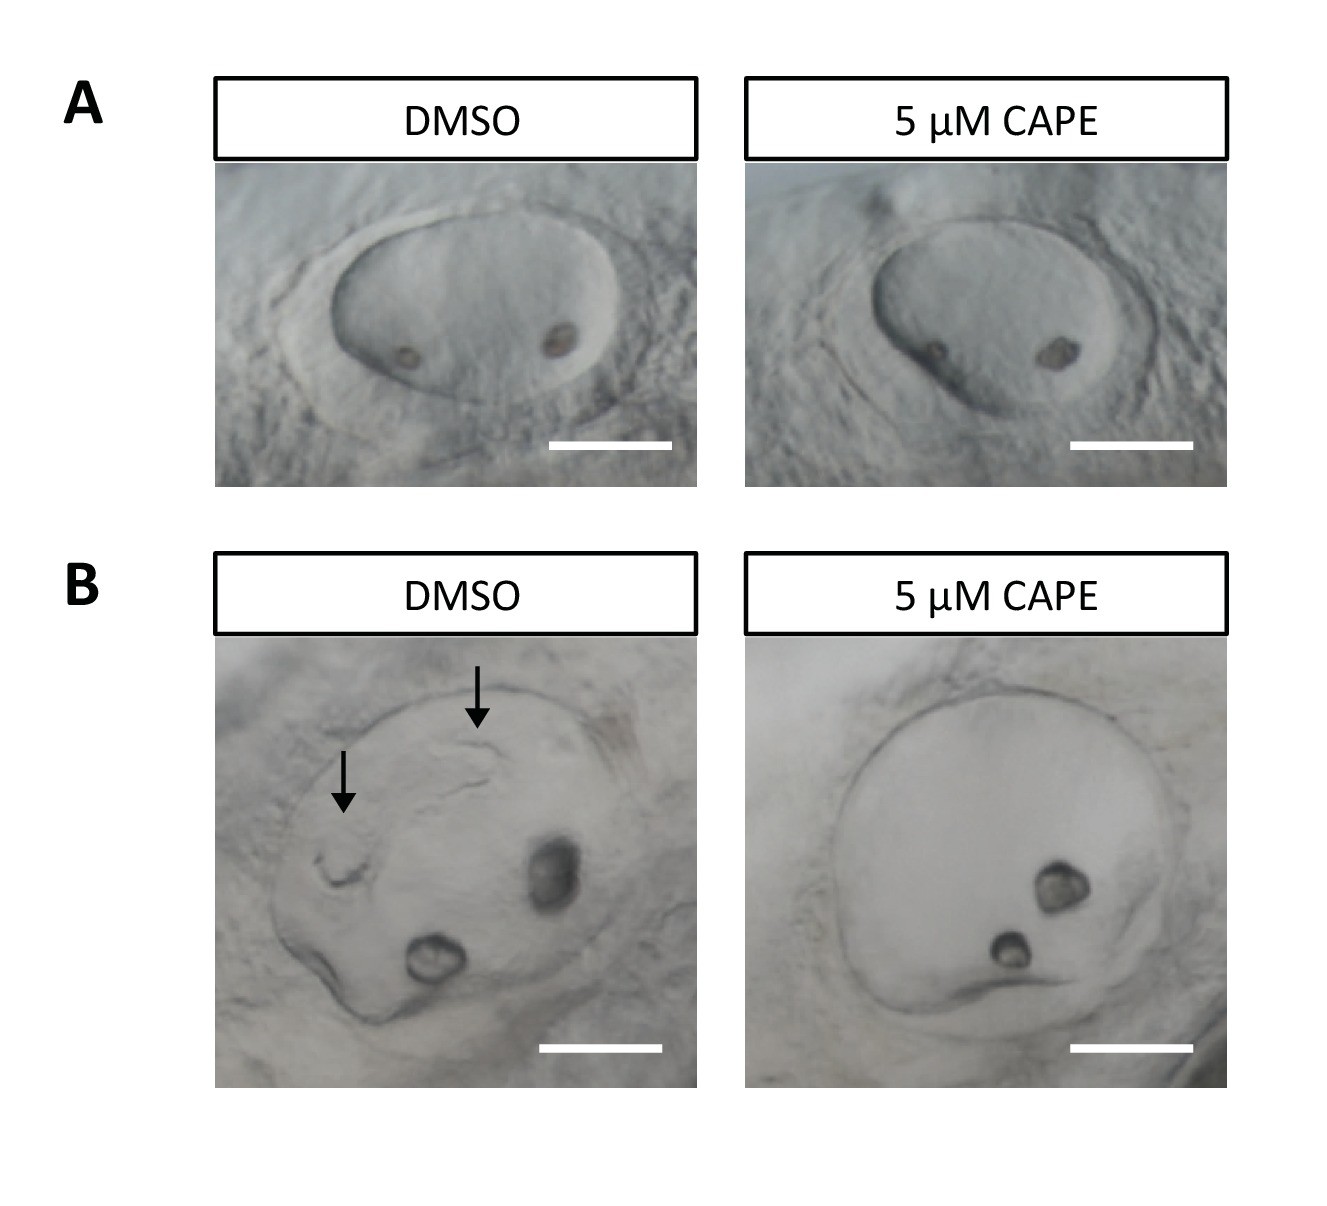
CAPE disrupts ear development.
Embryos were treated continuously from 2 ss. (A) Otic vesicles of control and CAPE-treated embryos at 24 hpf. (B) Otic vesicles of control and CAPE-treated embryos at 48 hpf. Note lack of semicircular canal projections (arrows). Scale bar: 50 μm.
Acknowledgments
This image is the copyrighted work of the attributed author or publisher, and
ZFIN has permission only to display this image to its users.
Additional permissions should be obtained from the applicable author or publisher of the image.
Full text @ Elife