
|
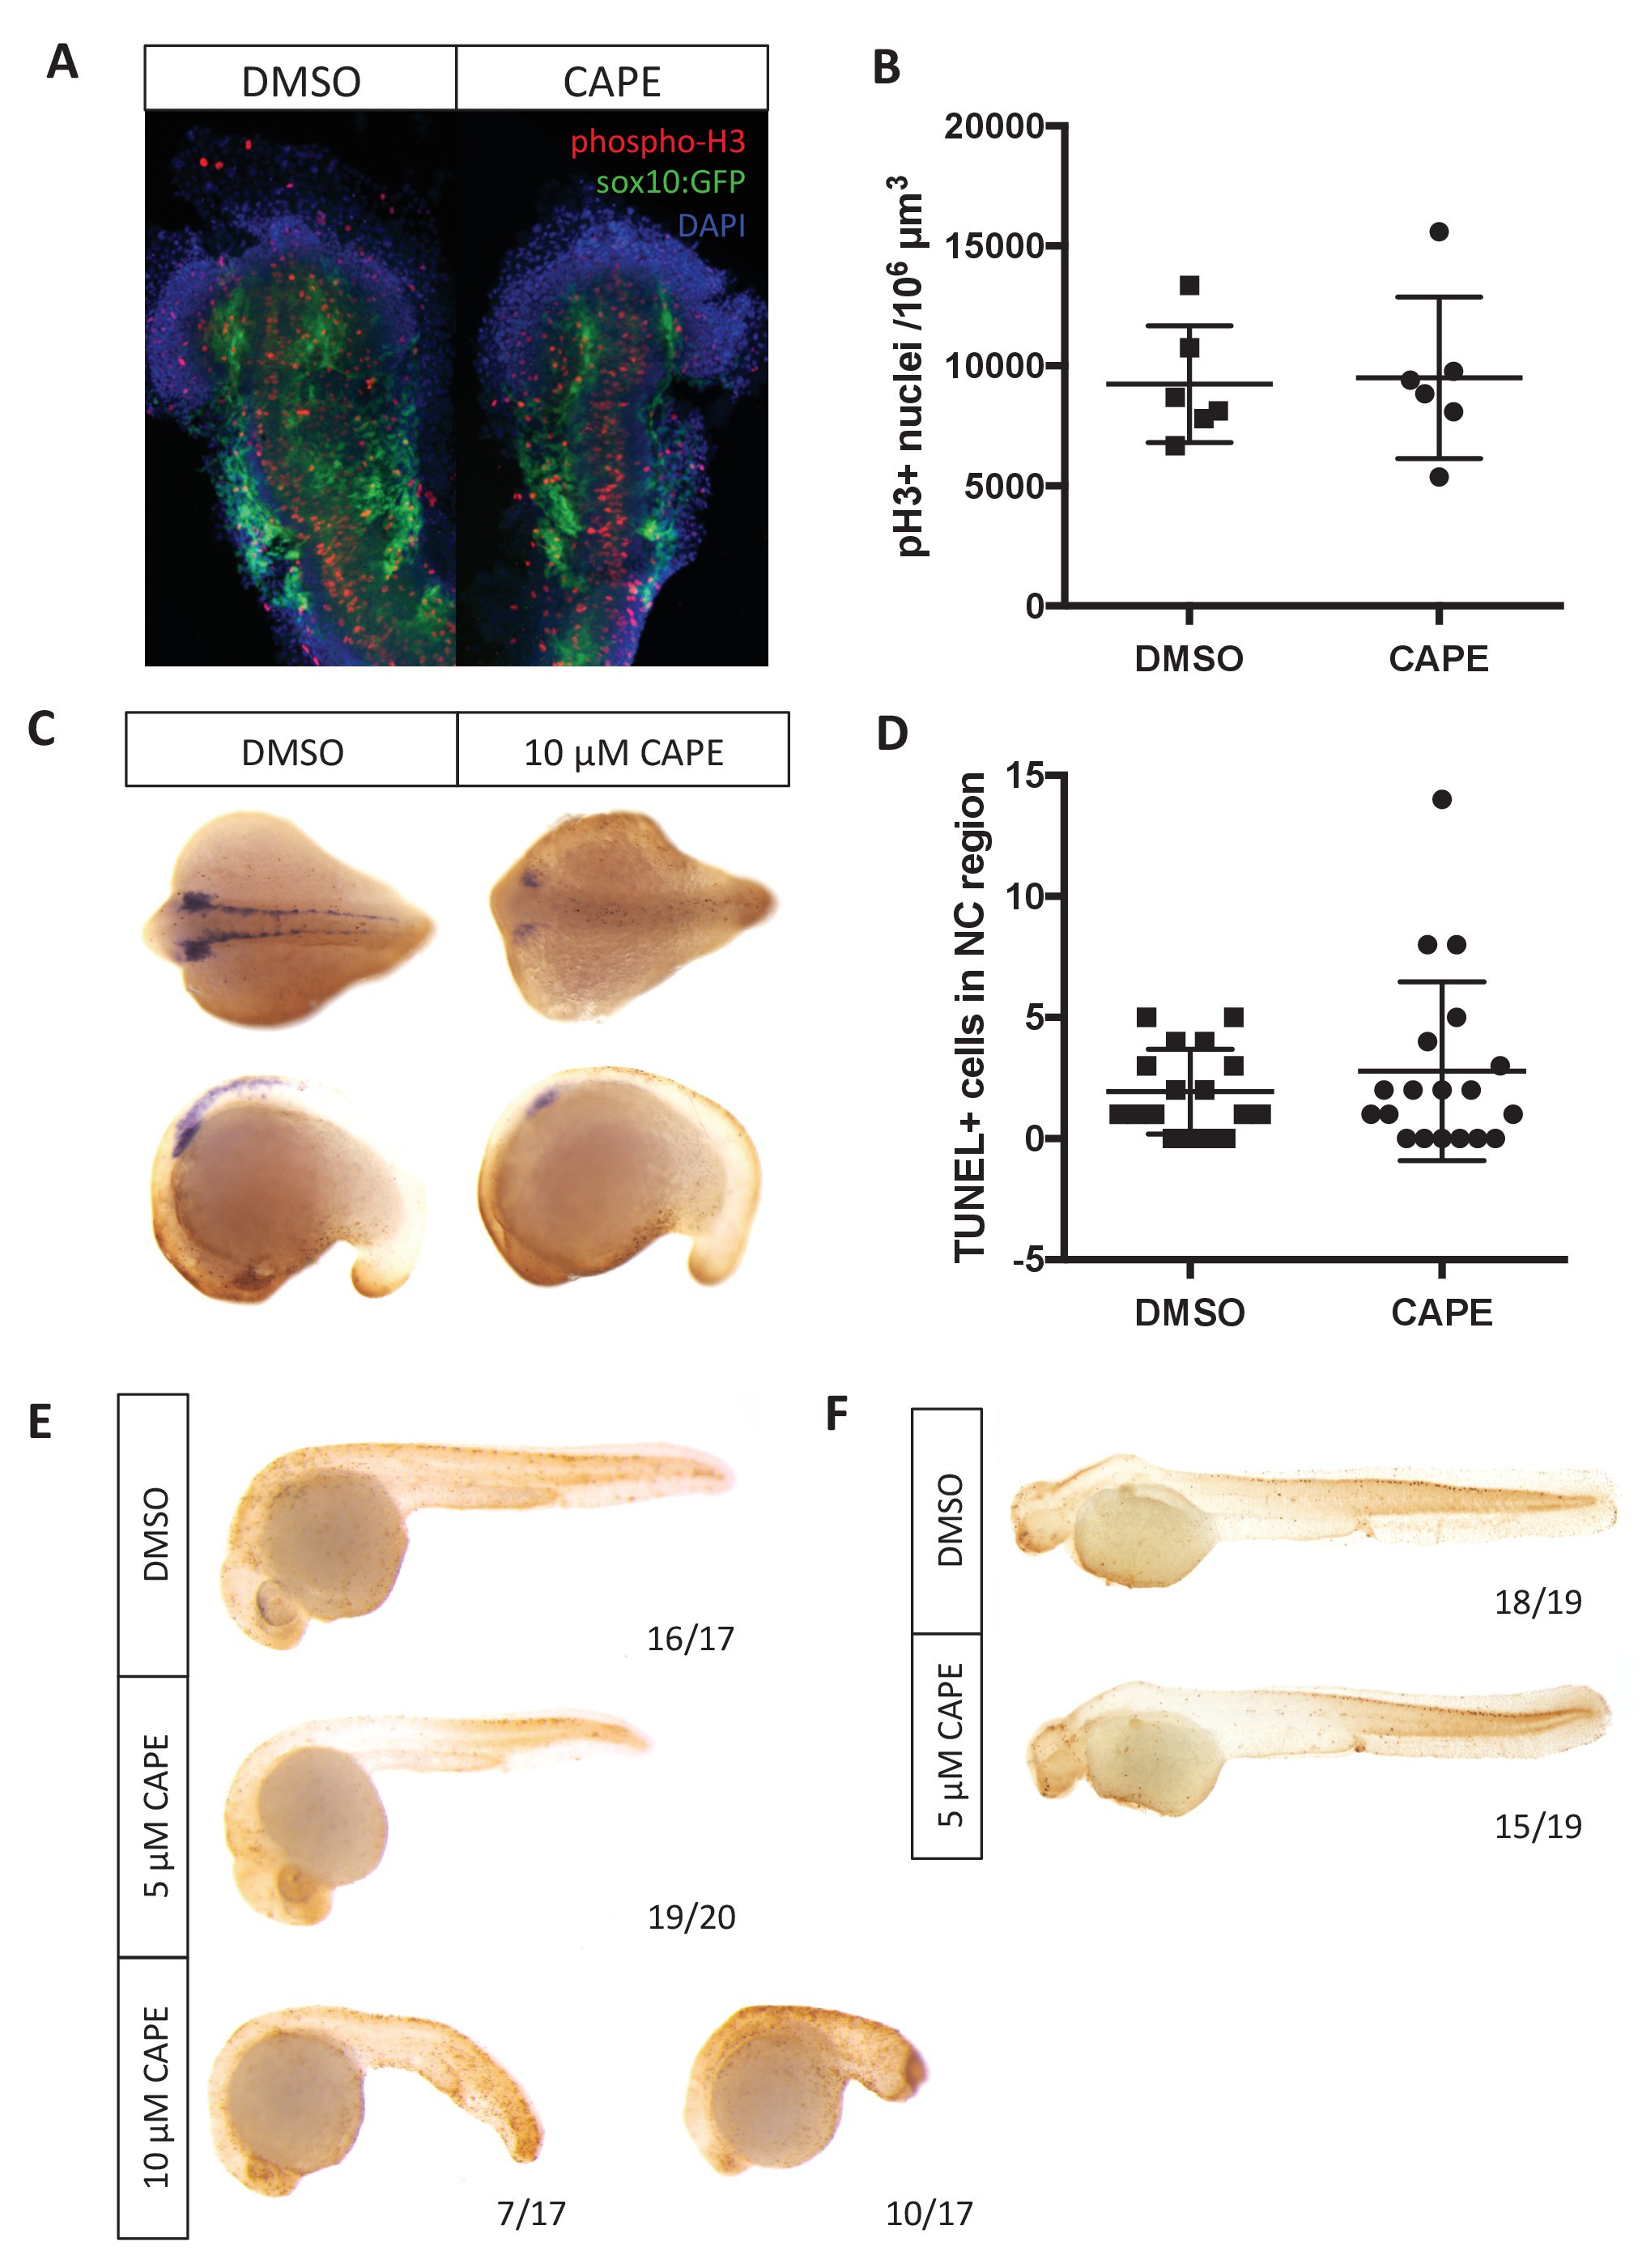
Fig. 2 S3
Changes in cell number do not explain reduced crestin expression in CAPE-treated embryos.
Embryos were treated continuously starting at 2 ss. (A) CAPE does not affect proliferation of neural crest cells as determined by phospho-histone H3 in the sox10:GFP+ region of embryos. Flat mounts of representative embryos are shown. Results are representative of two independent experiments. (B) Quantification of images in (A). Images were quantified using Imaris. Bars indicate the average and SEM of 6 embryos per condition from the same clutch. (C) CAPE does not increase cell death in the neural crest region of embryos after 5–6 hr of treatment. Representative embryos show whole mount TUNEL (brown) and crestin ISH (purple). (D) Quantification of embryos in (C). Quantification was conducted manually. Average and standard deviation of two independent experiments are shown. (E) 10 μM but not 5 μM CAPE broadly increases cell death after 19 hr of treatment. (F) 5 μM CAPE does not substantially alter cell death at 48 hpf.