
Image
|
Figure Caption
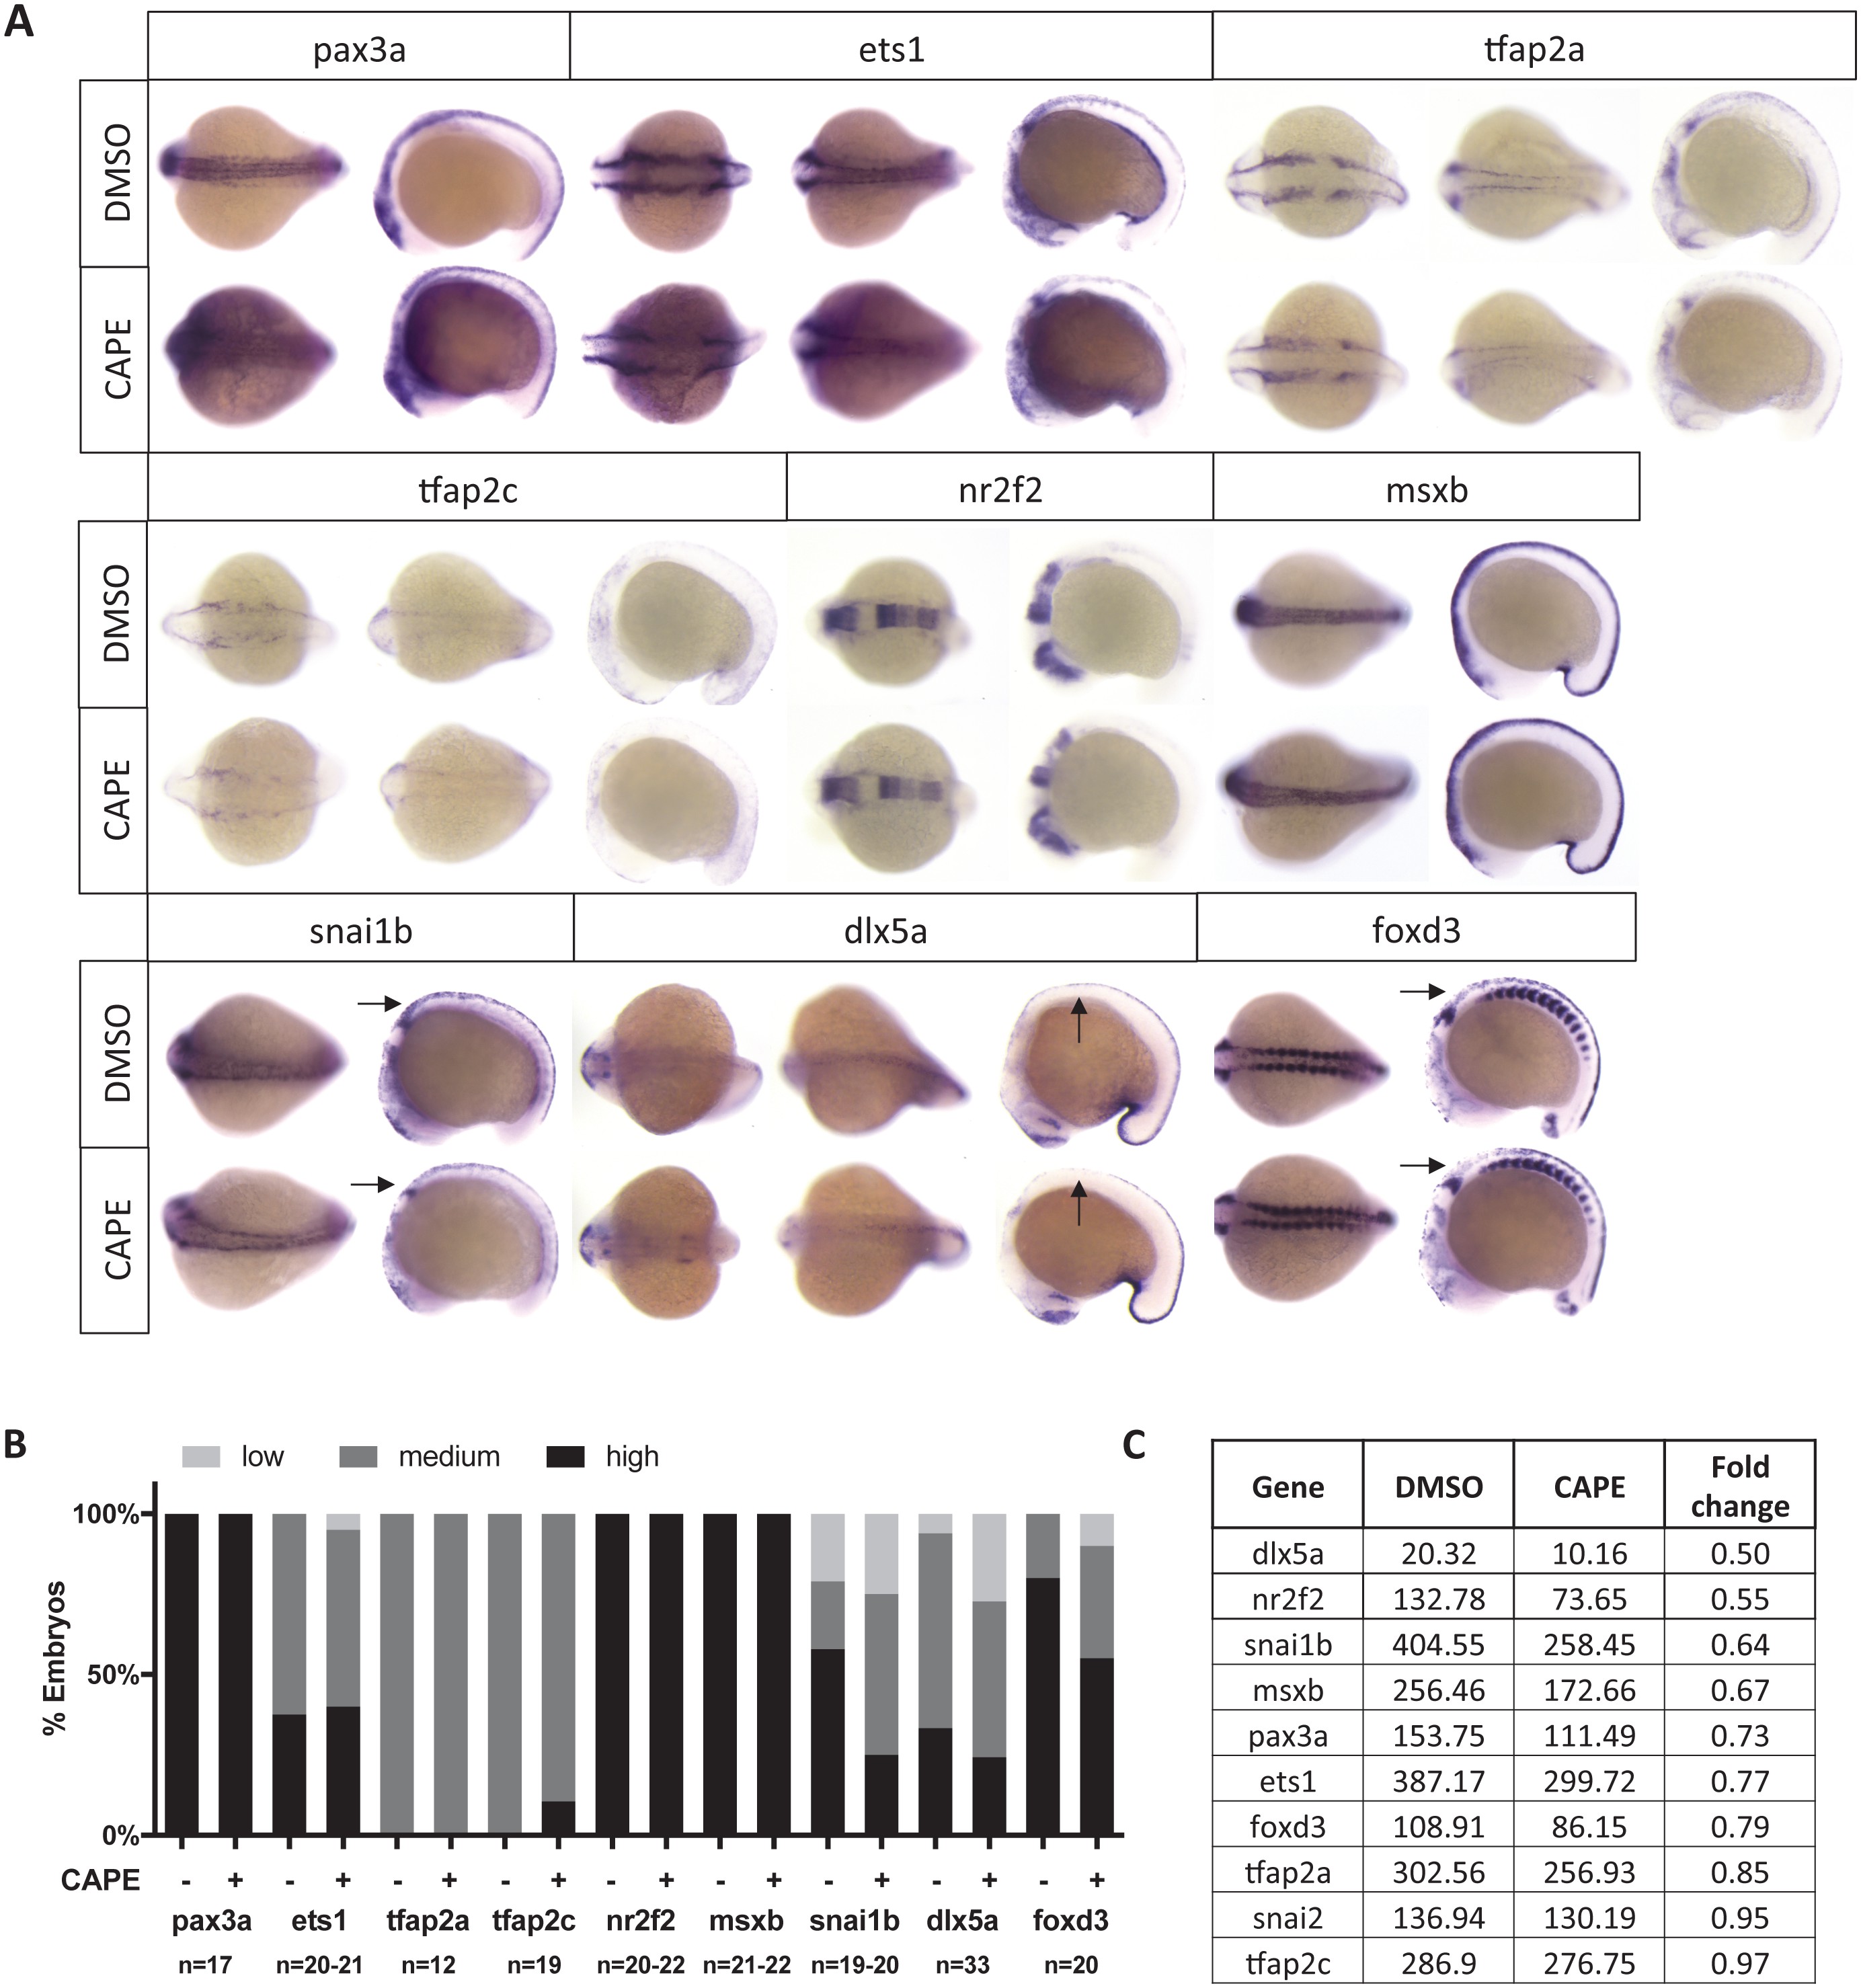
Fig. 2 S2
Neural crest genes not significantly affected by CAPE treatment as determined by ISH.
(A) Representative embryos from ISH. Images are representative of at least two independent experiments. Arrows point to regions with subtle decreases in expression. (B) Scoring of ISH in (A). Images with arrows were scored only in the region of interest. No statistically significant changes were observed in the genes listed (p>0.05, chi-square test). (C) Expression as determined by RNA-seq of sox10:Kaede+ cells. Some genes that appeared unchanged by ISH were decreased by RNA-seq.
Acknowledgments
This image is the copyrighted work of the attributed author or publisher, and
ZFIN has permission only to display this image to its users.
Additional permissions should be obtained from the applicable author or publisher of the image.
Full text @ Elife