
|
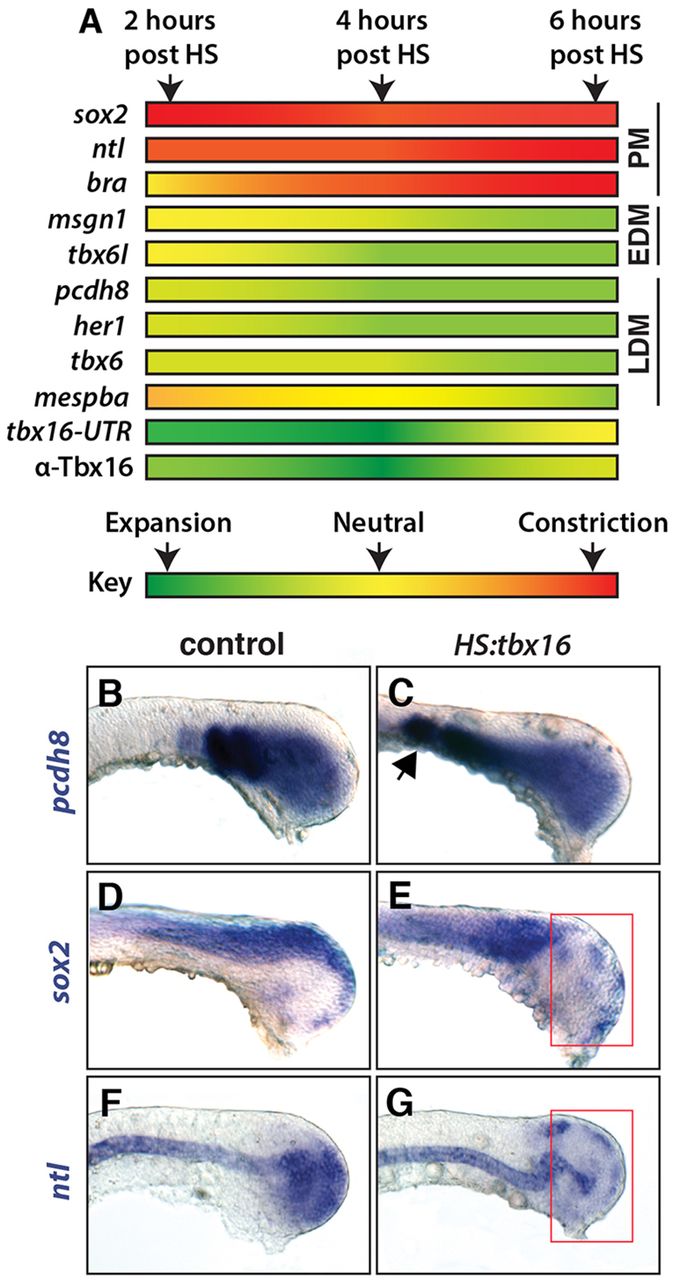
Fig. 2
tbx16 expression represses genes involved in maintaining the progenitor zone. (A) Summary of changes in gene expression after the induction of ectopic tbx16 (based on the data in supplementary material Fig. S3 and Table S1). Arrows indicate the number of hours post-heat shock (HS) and the colors represent expansion (green), constriction (red) or no change (yellow) to expression, with intermediate shades marking the degree of difference. PM, progenitor markers; EDM, early differentiation markers; LDM, late differentiation markers. α-Tbx16 indicates Tbx16 assessed by immunostaining. (B-G) In situ hybridization shows changes to gene expression in the tailbud of HS:tbx16 (C,E,G) and control (B,D,F) embryos at 6 h after heat shock. The arrow (C) points to expansion of pcdh8 and the red boxes (E,G) highlight the reduction of sox2 and ntl in the tailbud.