
Image
|
Figure Caption
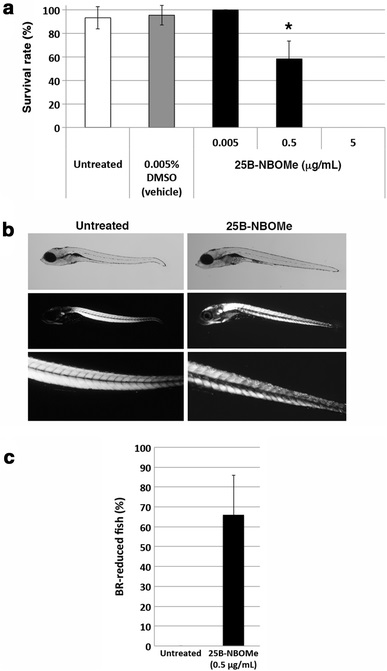
Fig. 1
a Survival rates of zebrafish larvae as a function of 25B-NBOMe concentrations, treated or untreated for 2 days. The asterisk shows the significant difference between vehicle and 0.5 μg/mL 25B-NBOMe groups (p = 0.00000458). b Microscopic photographs of zebrafish larvae untreated and treated with 0.5 μg/mL 25B-NBOMe. c Ratio of zebrafish larvae with reduced muscle birefringence (BR) after treatment with 0.5 μg/mL 25B-NBOMe and no treatment
Figure Data
Acknowledgments
This image is the copyrighted work of the attributed author or publisher, and
ZFIN has permission only to display this image to its users.
Additional permissions should be obtained from the applicable author or publisher of the image.
Full text @ Forensic Toxicol