
|
Fig. 2
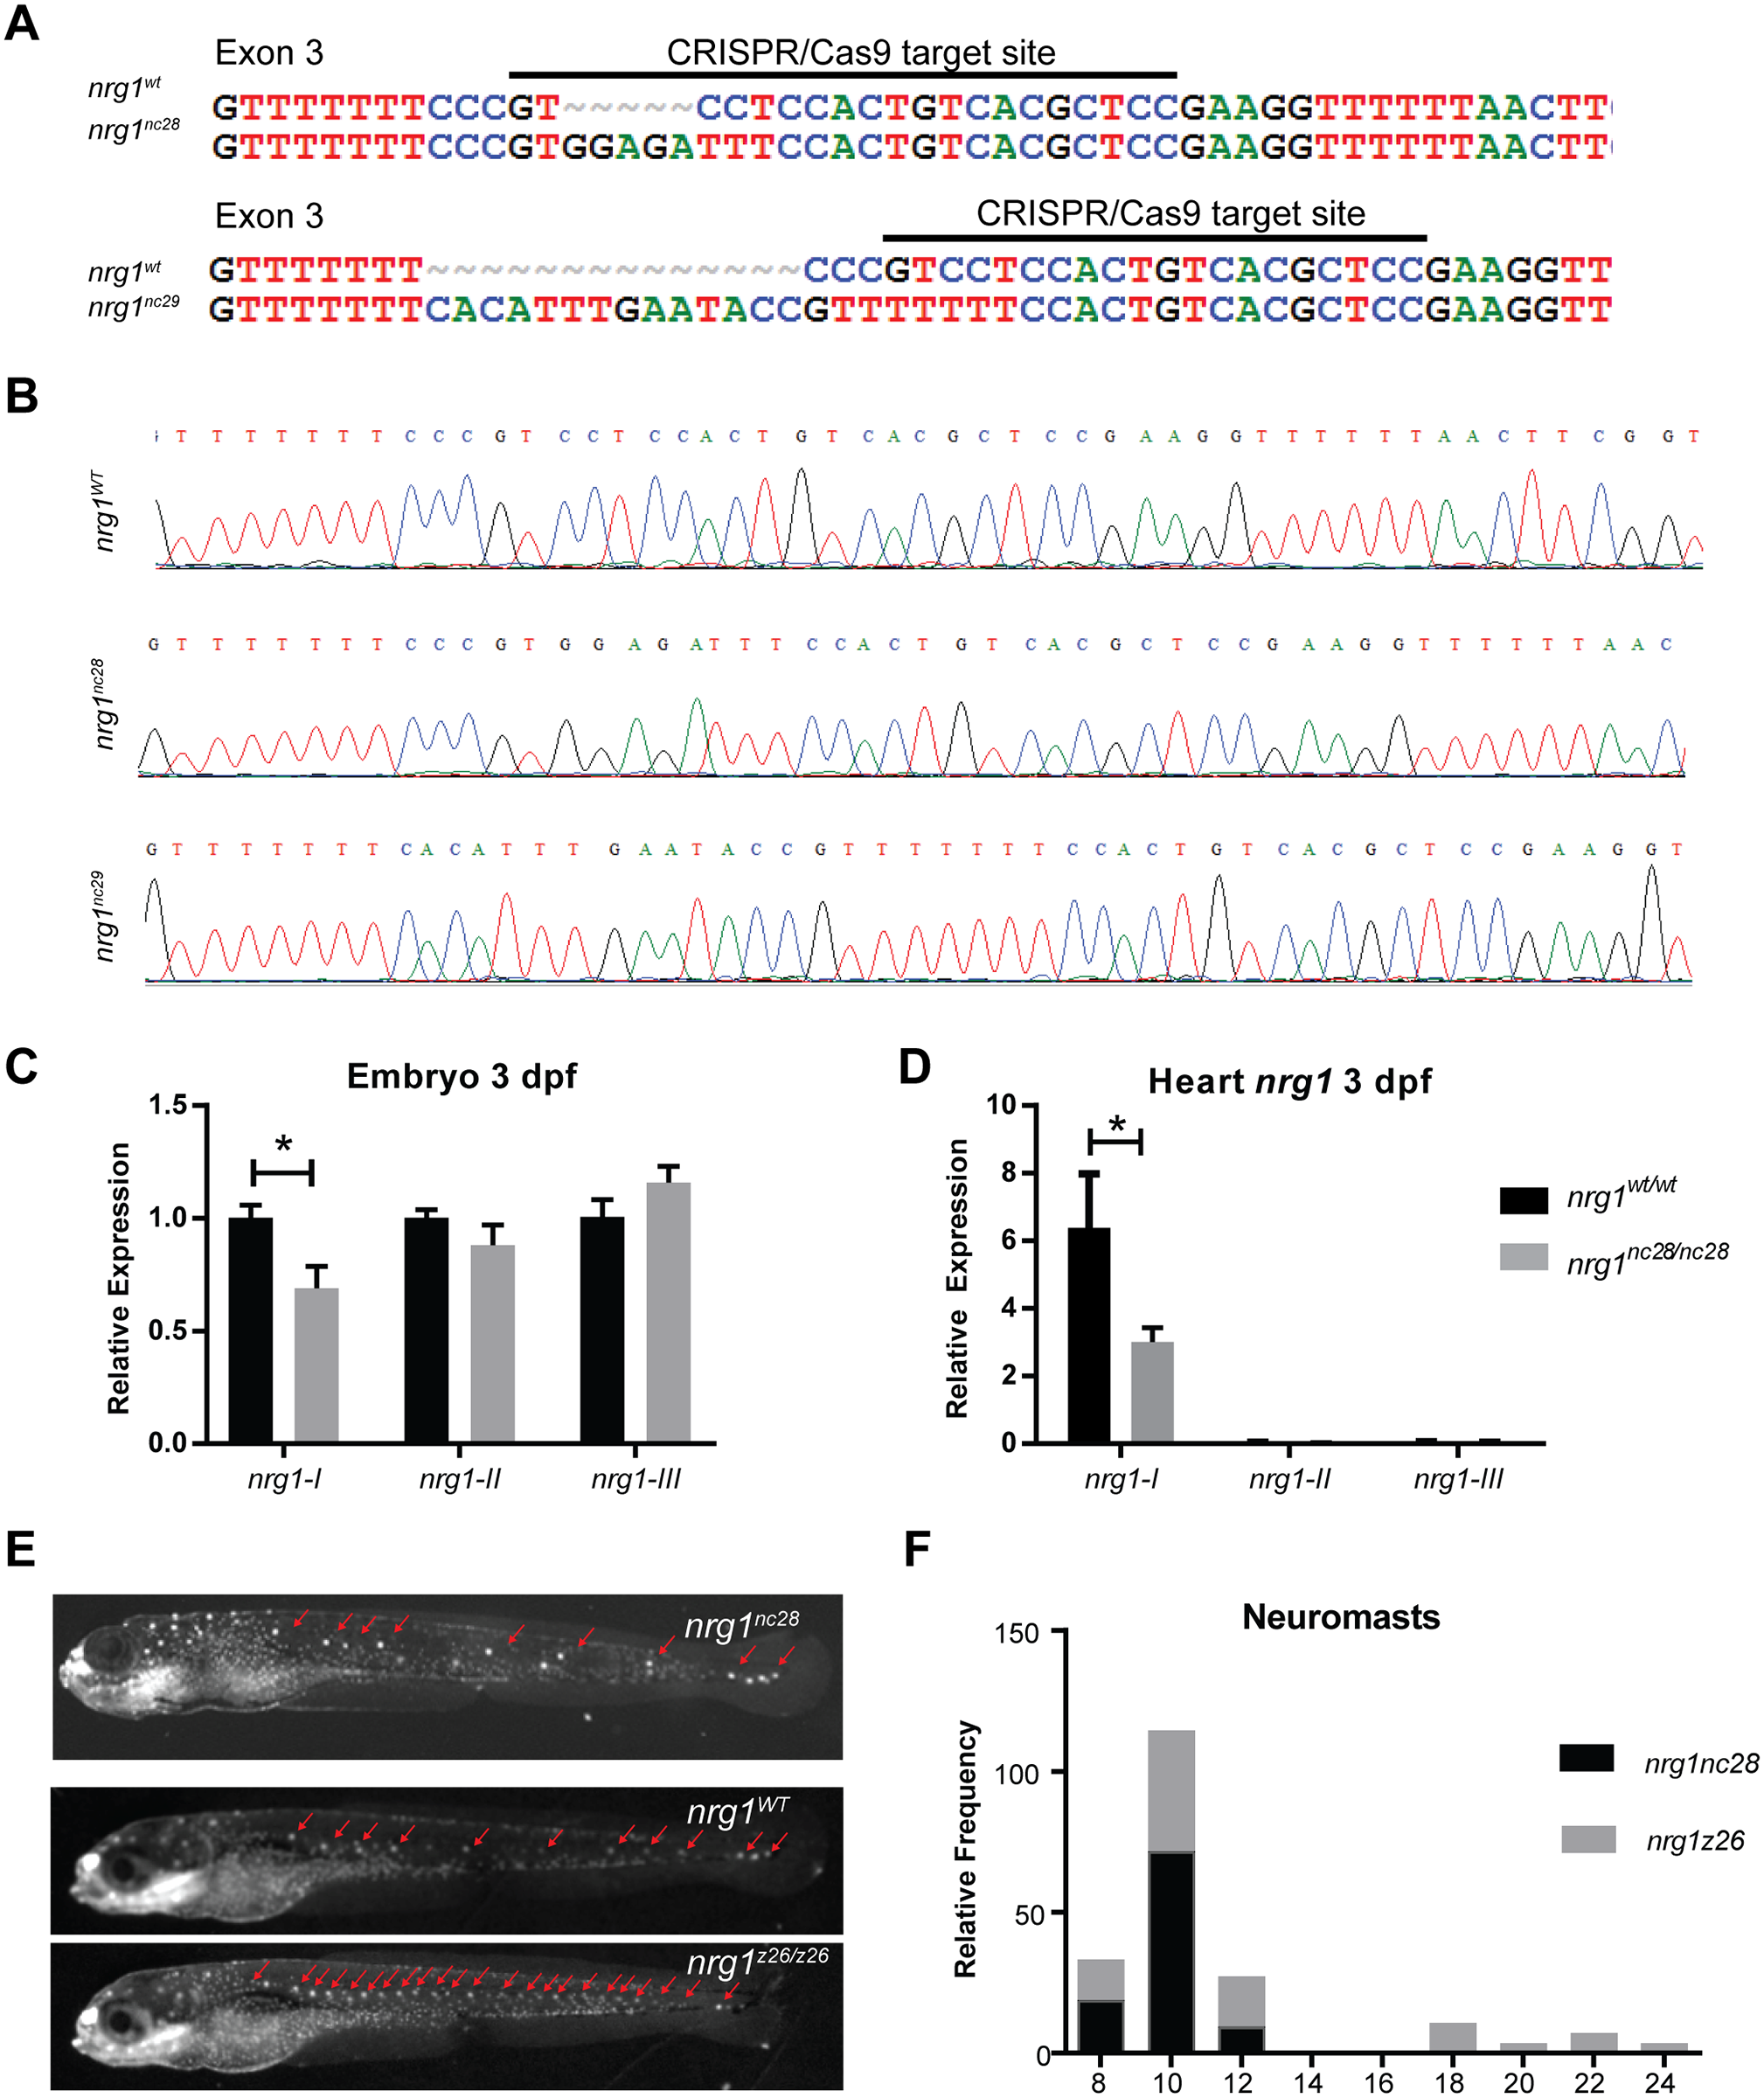
Zebrafish nrg1-I/II mutants.
(A) CRISPR/Cas9 gene targeting and validation of nrg1nc28 and nrg1nc29 alleles showing target site and mutations. (B) Sanger sequence of nrg1WT, nrg1nc28 and nrg1nc29 alleles spanning target site in Exon 3. (C) Gel electrophoresis and densitometry of nrg1 amplified from 10ng cDNA derived from nrg1WT or nrg1nc28/nc28 embryos at 5 dpf. Student’s T-test compared to matched control. Error bars are SEM. N≥3 biological replicates. *p≤0.05–0.01. (D) Representative Mitotracker stain for neuromasts. Heterozygous adult fish carrying nrg1WT/nc28, nrg1WT/nc26, or nrg1WT/z26 alleles were inbred, and resulting offspring were evaluated for supernumerary neuromasts (red arrows). (E-F) Frequency distribution of the number of neuromasts per embryo. Blue bar marks range of neuromasts found in wild type larvae; red bars mark supernumerary neuromasts. Similar results were obtained with nrg1nc29 lines (data not shown). N = 15–20 embryos imaged per pairing; N = 2 biological replicates.