
|
Fig. 1
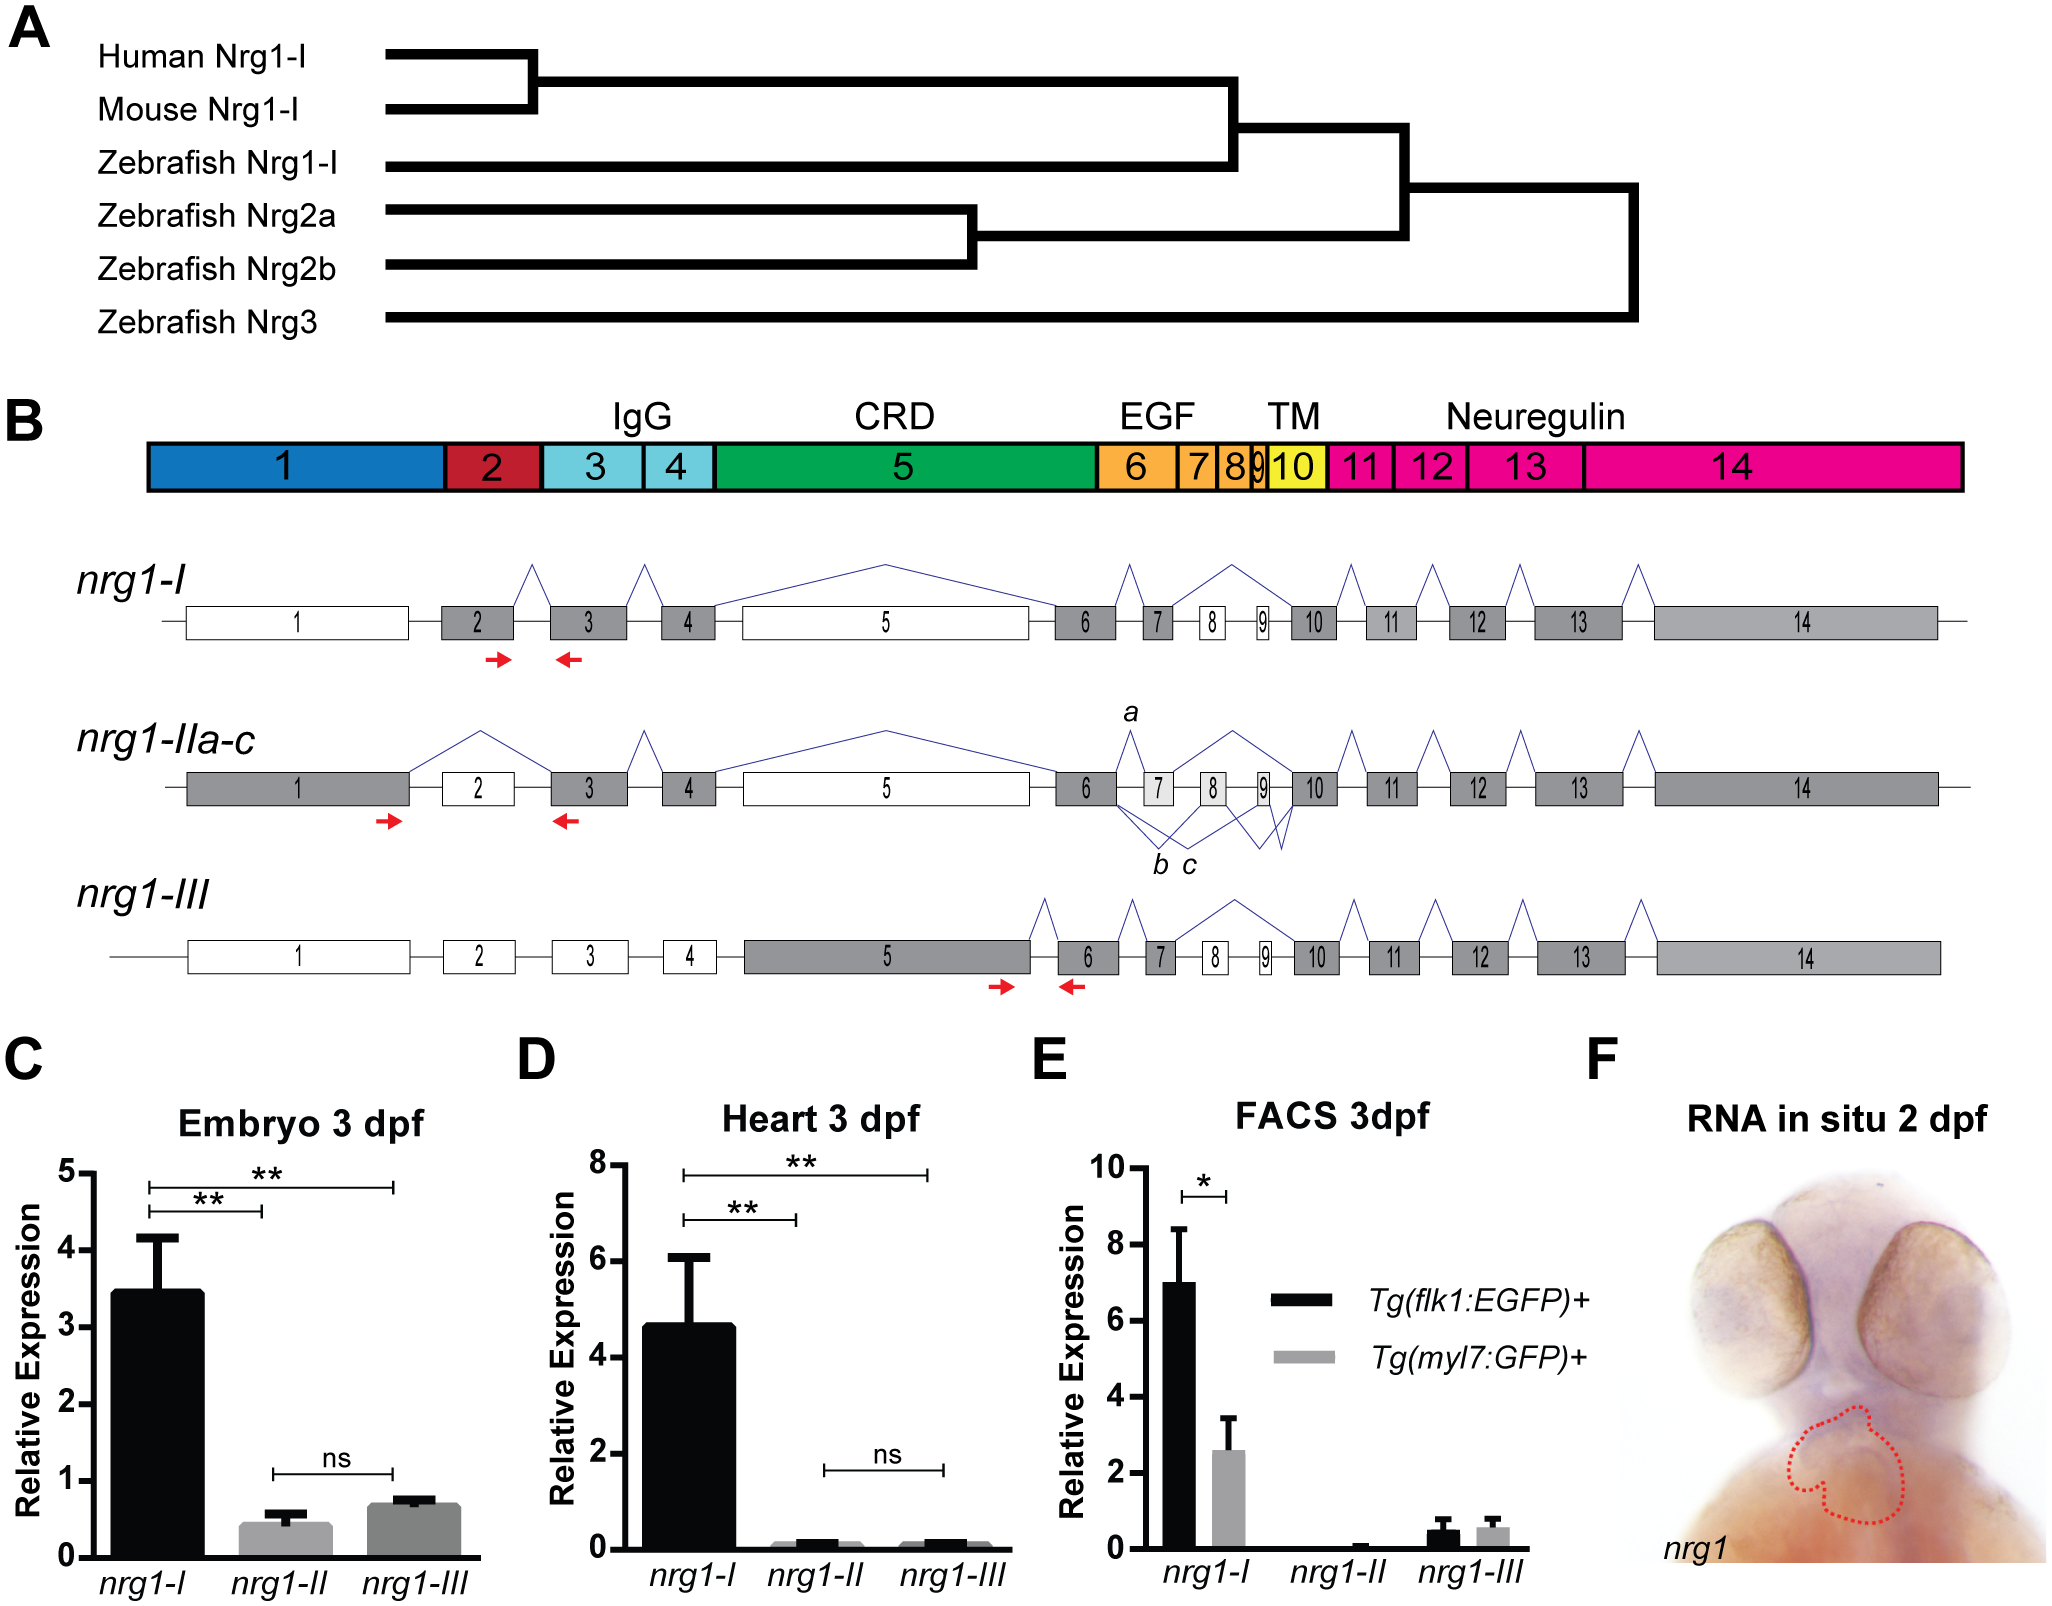
Zebrafish Neuregulin 1 and the expression of its isoforms.
(A) Gene tree from Clustal-Omega multiple alignment comparison. (B) Schematic of Nrg1 domains encoded by Exons 1–14. (C) Schematic of nrg1 gene structure. Exons are drawn to scale; introns are not to scale. Alternative splicing produces three primary isoforms, nrg1-I, nrg1-IIa-c, and nrg1-III. (D-E) Relative expression of nrg1 isoforms in (D) 3 dpf embryos and (E) dissected hearts from 3 dpf embryos normalized to efl1a. (F) In situ hybridization of anti-sense riboprobe targeting nrg1. Heart is outlined in red. Student’s T-test compared to matched control. Error bars are SEM. N≥3 biological replicates. *p≤0.05–0.01, **p≤0.01–0.001, ***p<0.001.