
|
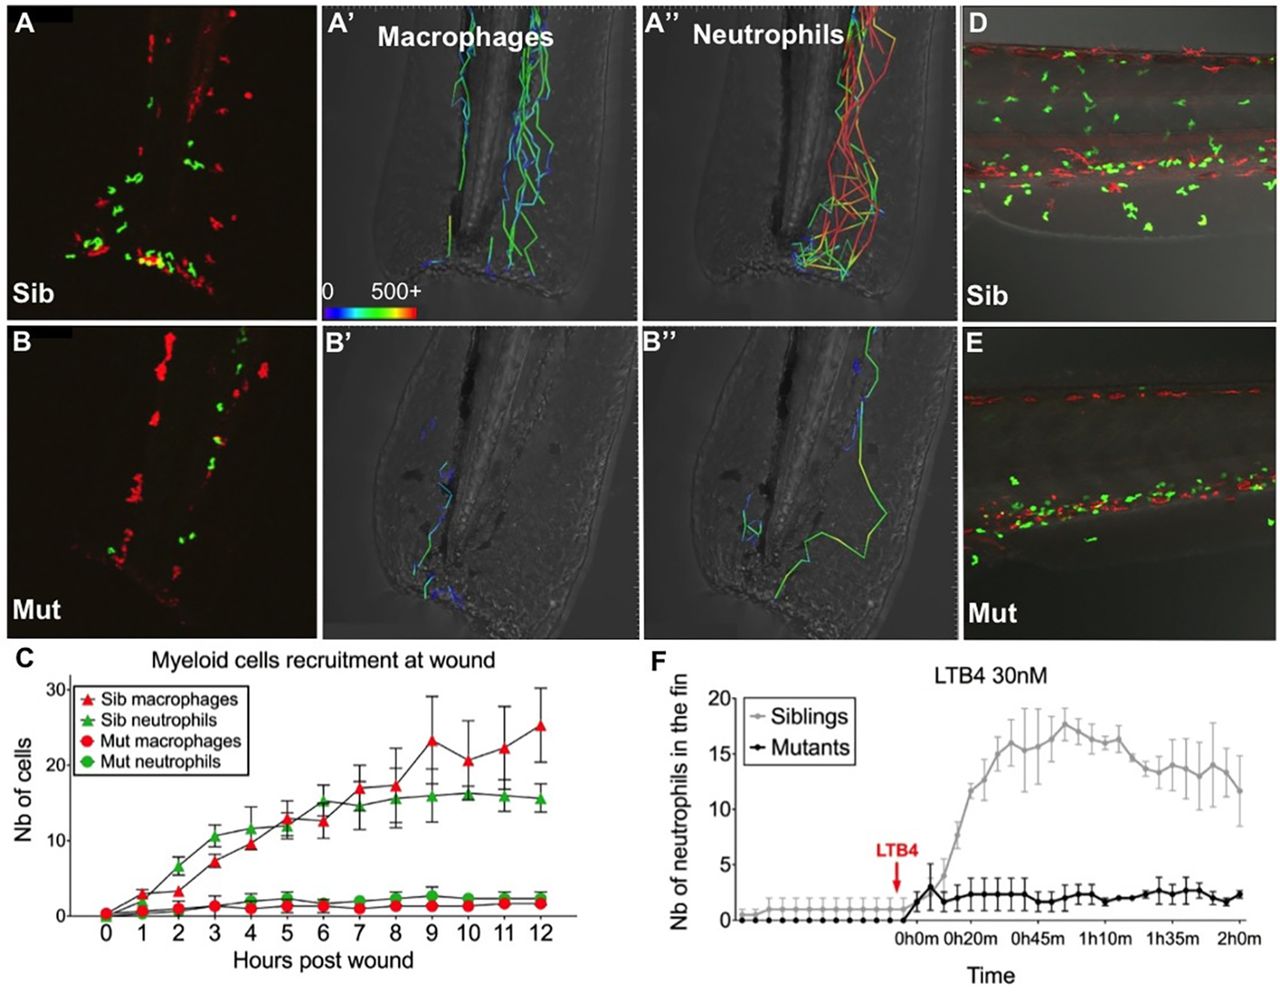
Fig. 5
Moonshine mutant myeloid cells do not respond to attractive signals. (A–E) In vivo confocal time-lapse imaging of the caudal fin (A–B″) or CHT region (D,E) of 3-day-old monNQ039Tg(mpeg1:mCherry;mpx:gfp) siblings (Sib) (A–A″,D) and mutants (Mut) (B–B″,E); macrophages are red, neutrophils are green. (A–B″) Fluorescence images at 9 h post tail fin tip transection (9 hpw) (A,B) and trajectories of the first recruited cells, from 0 to 3 hpw (A′–B″); cell speeds (in µm/h) are colour coded as indicated by the bar in A′; cell speeds ≥500 µm/h are all coded in red. (C) Macrophage and neutrophils counts (Nb, number) at the wound over time (mean±s.e.m.; n=3 sibling and 3 mutant larvae). (D–F) LTB4 addition experiment. (D,E) Images at 1.5 h post LTB4 addition, showing the recruitment of neutrophils from the CHT to the ventral fin and skin in the sibling (D), but not in the mutant (E). (F) Neutrophil counts in the ventral fin during the time-lapse sequence (n=3 experiments).