
|
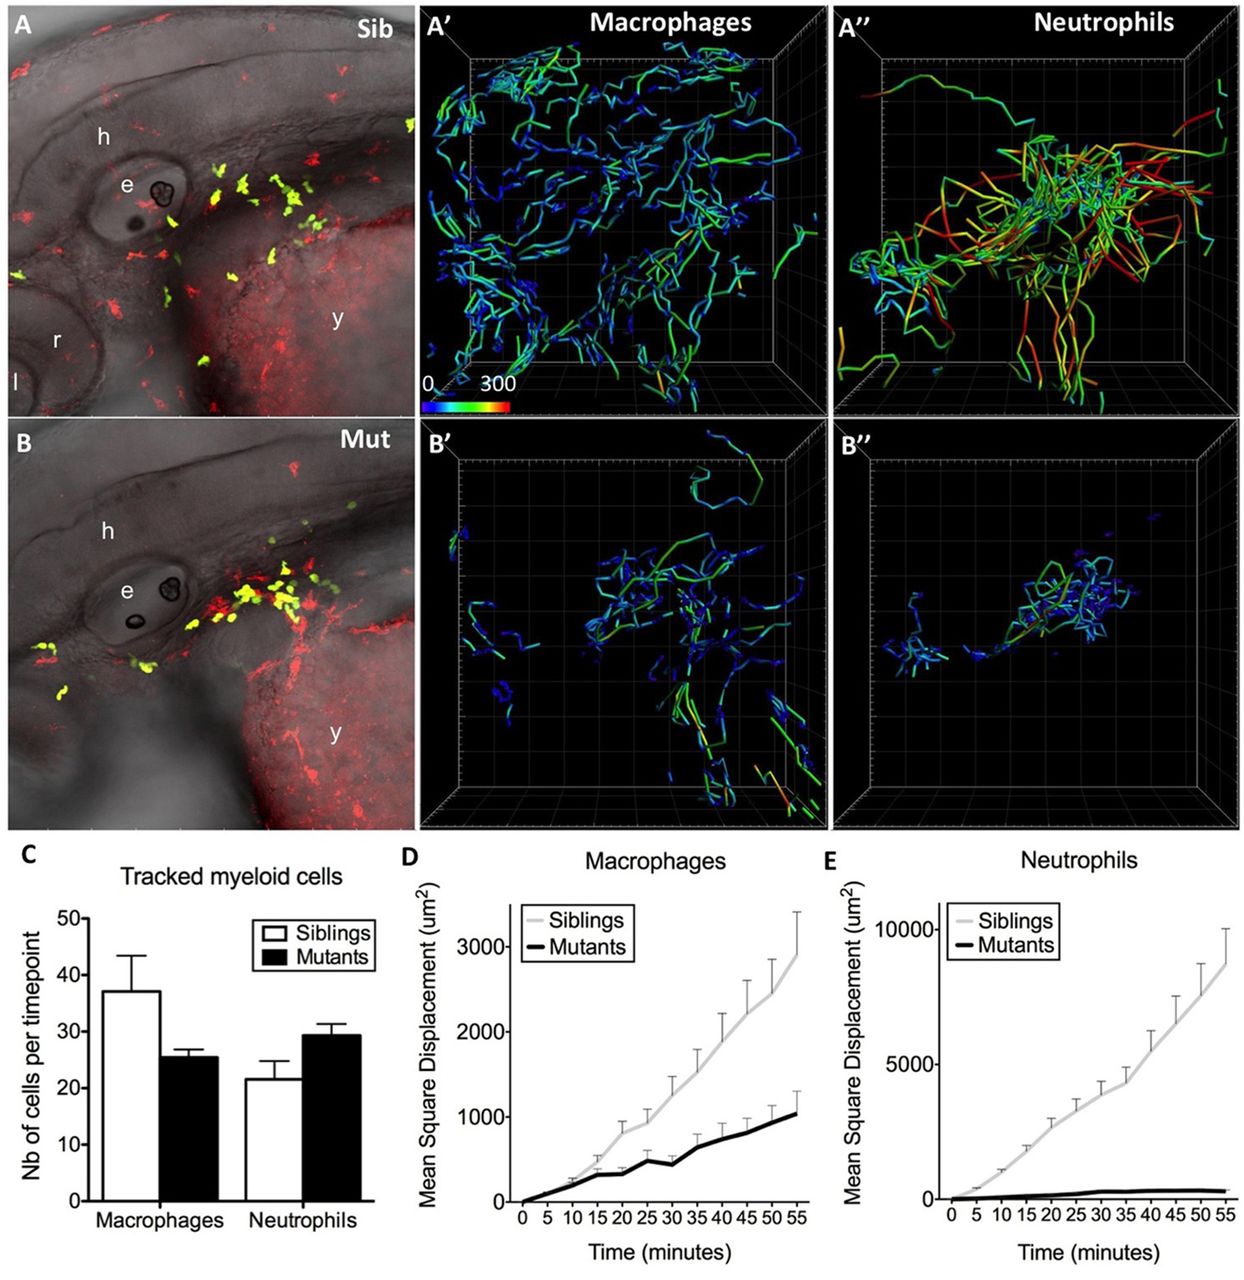
Fig. 4
The basal migration in interstitial tissues of both macrophages and neutrophils is affected in moonshine mutants. In vivo 4D tracking of mCherry-positive macrophages and GFP-positive neutrophils in the head and anterior yolk sac area of monNQ039Tg(mpeg1:mCherryF; mpx:gfp) sibling (Sib) (A–A″) and mutant (Mut) (B–B″) embryos at 48 hpf. e, ear; l, lens; y, yolk sac; h, hindbrain; r, retina. Cell trajectories are shown in panels (A′,A″,B′,B″), with colour coding of speed (from 0 to 300 µm/h), and the number (Nb) of cells tracked per time point in each case is shown in C (as mean±s.d. for 80 time points). (D,E) Quantification of the mean±s.d. square displacement over time illustrates the migration defect of the mutant leukocytes.