
Image
|
Figure Caption
Fig. S2
Kdm2aa-deficient fish develop melanoma. (related to Fig 2).
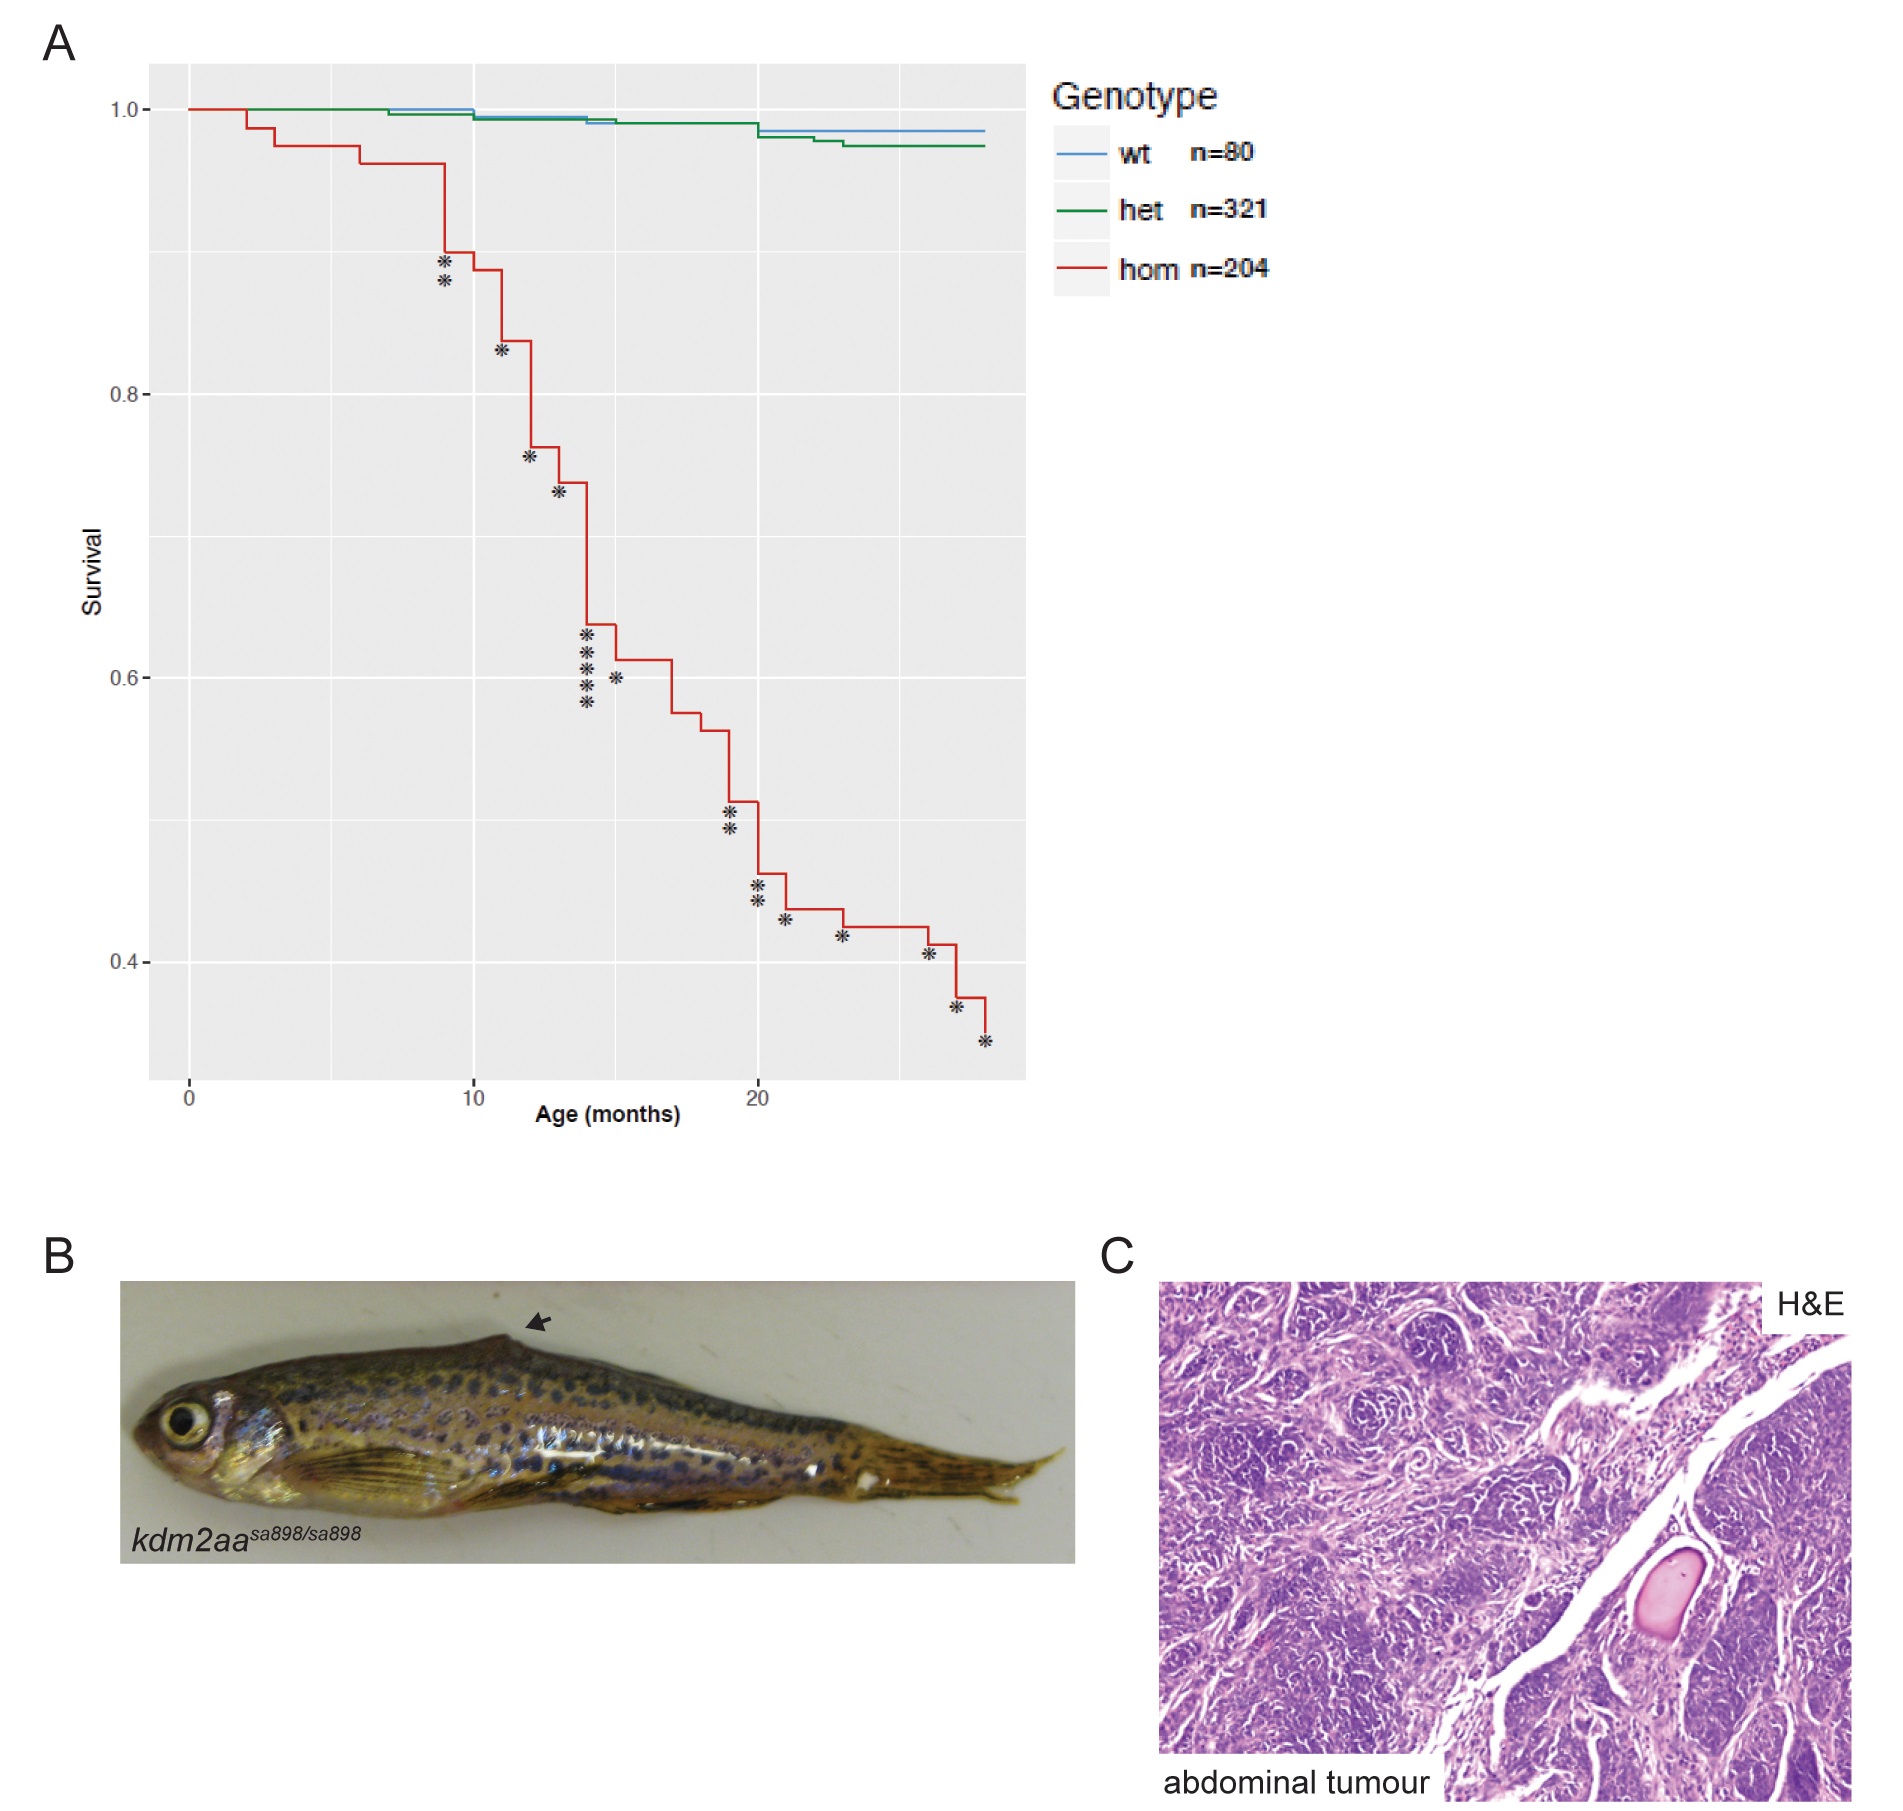
(A) Survival graph for kdm2aasa9360 showing incidence of suspected cancer. Each (*) indicates a single culled fish due to suspected cancer. No wild-type or heterozygous siblings developed any suspected cancers. (B) kdm2aasa898 homozygous fish with a mass on its body (arrow). (C) H and E stained section through the abdominal mass of a kdm2aas8980/sa898 fish showing epithelioid and spindle cells with a nested pattern involving skeletal muscle.
Acknowledgments
This image is the copyrighted work of the attributed author or publisher, and
ZFIN has permission only to display this image to its users.
Additional permissions should be obtained from the applicable author or publisher of the image.
Full text @ PLoS Genet.