
|
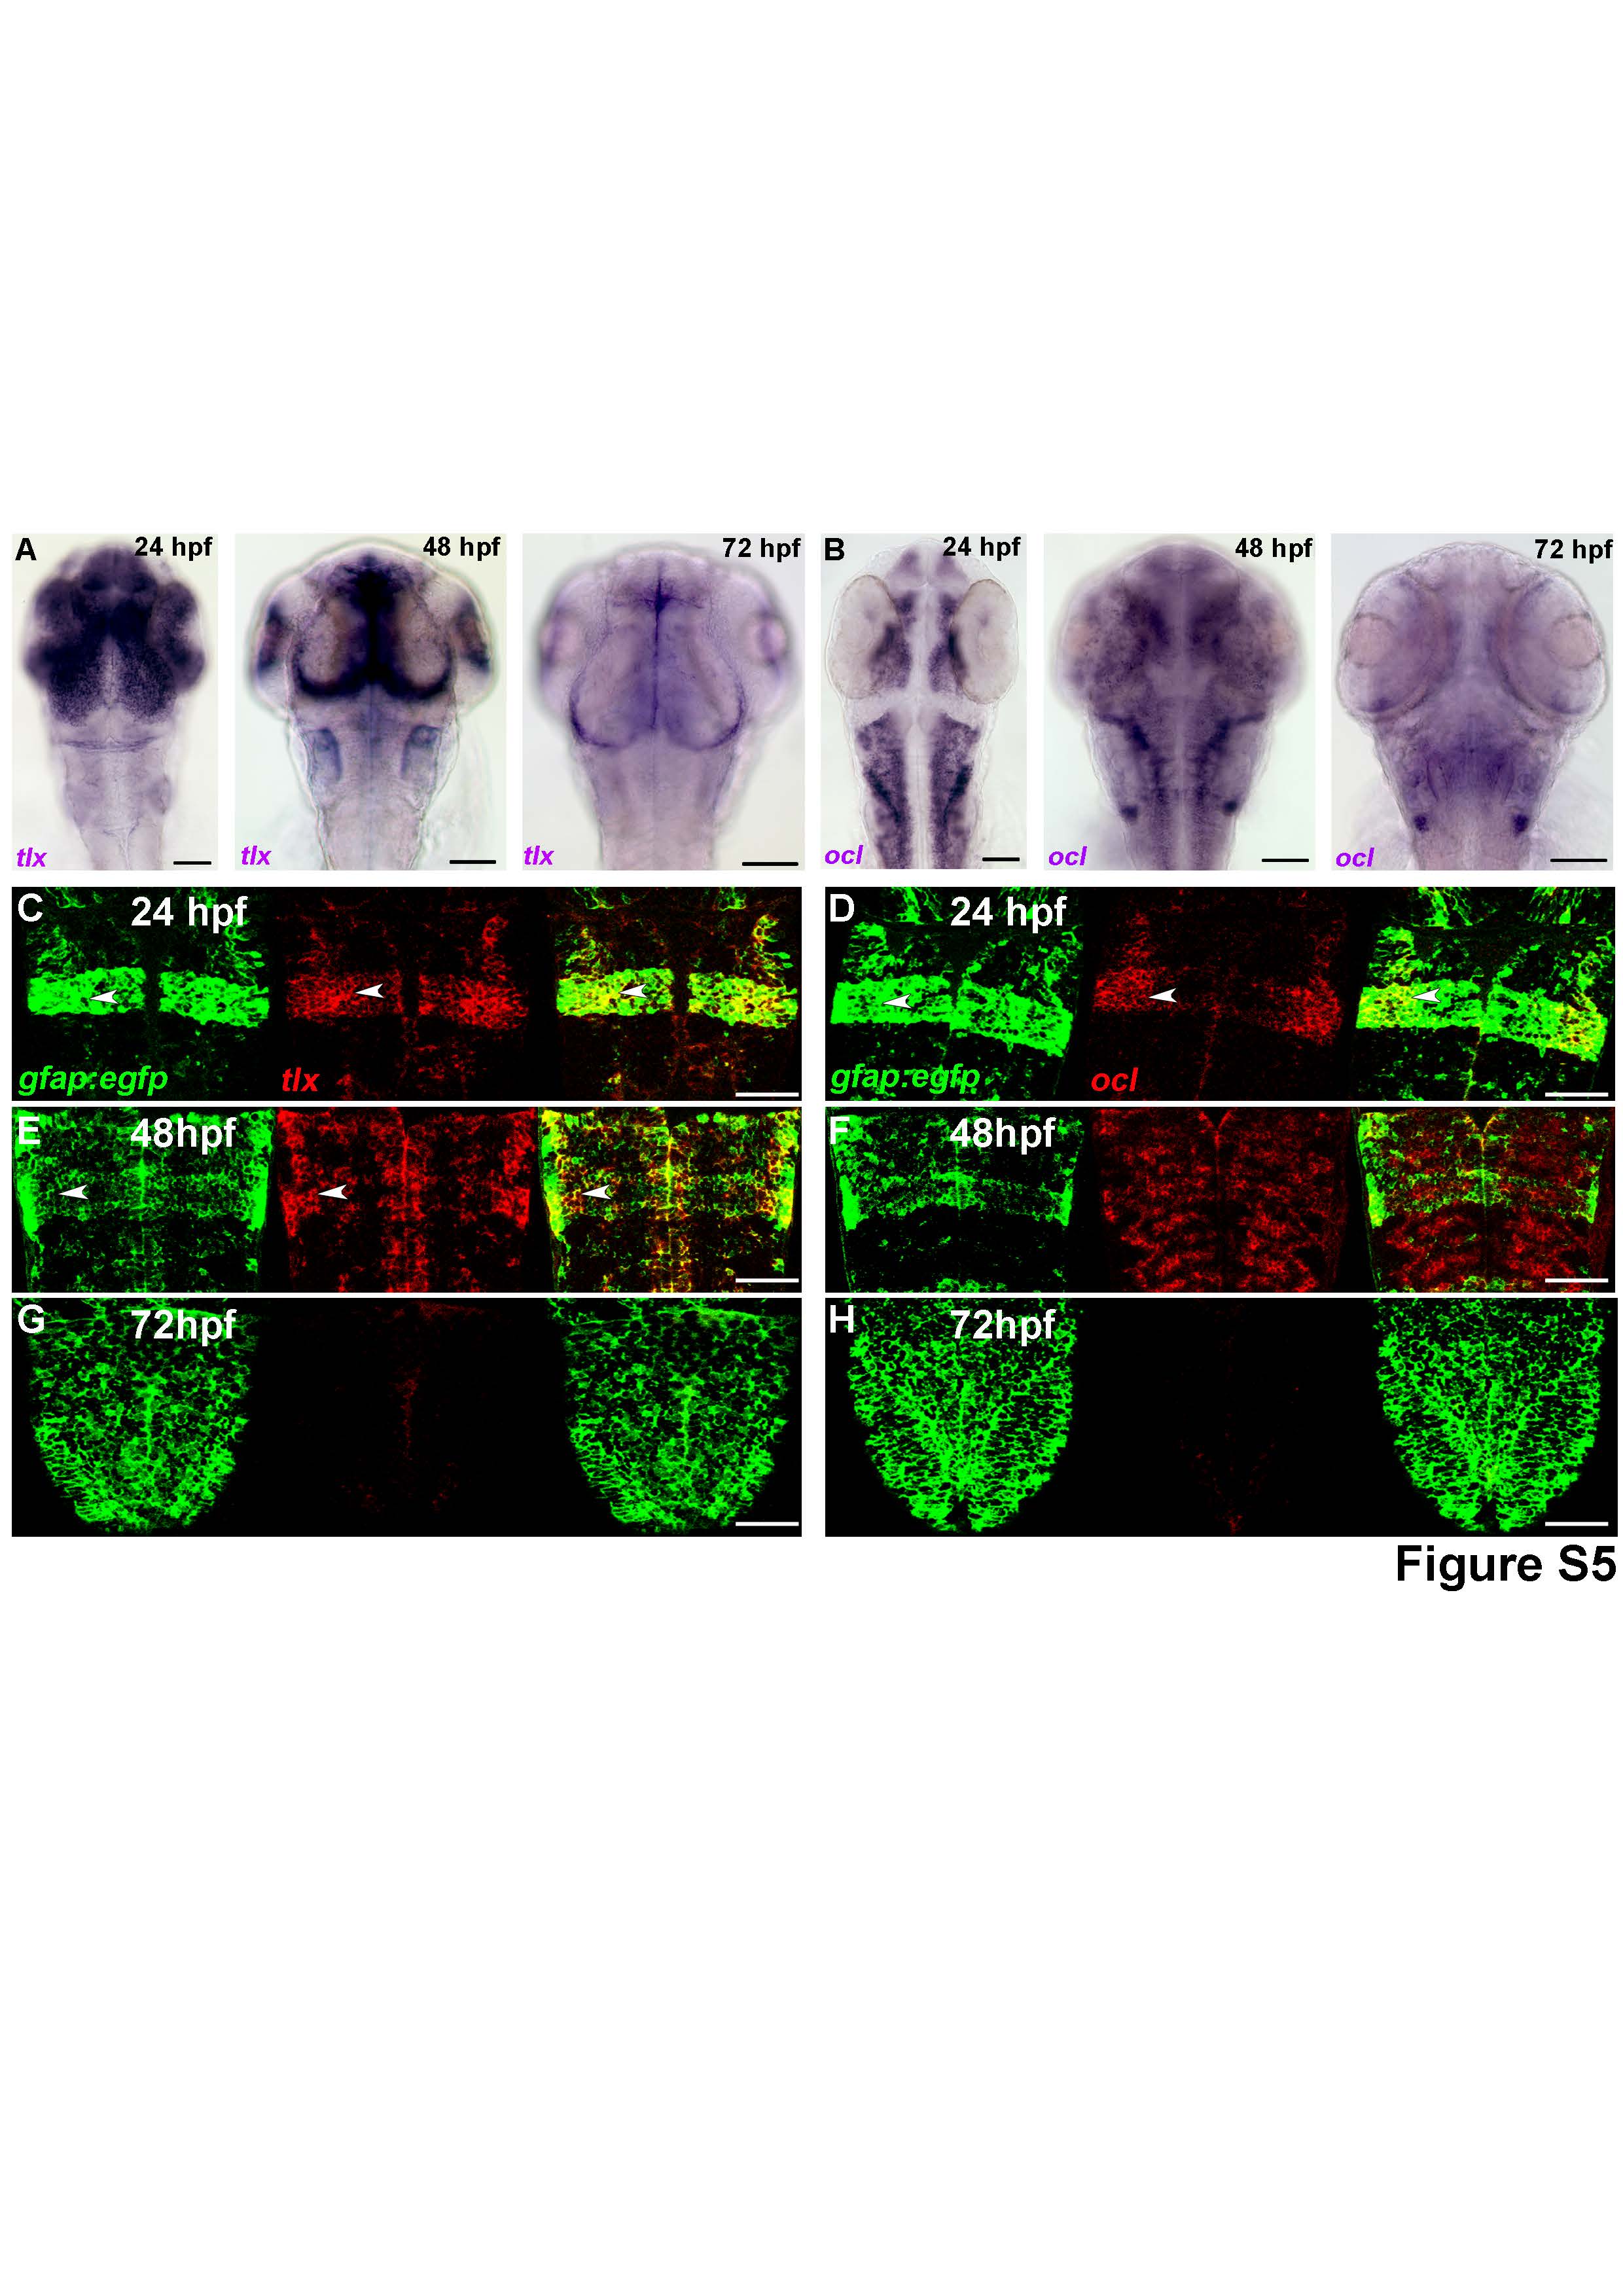
Fig. S5
Neural expression of tlx and ocl (related to Figure 3)
(A, B) Whole-mount in situ hybridization showing the time course of tlx (A) and ocl (B) expression in the developing embryo at 24, 48 and 72 hpf. During development, when miR-9 expression becomes broader and stronger after 24 hpf, we observe a correlative decrease in tlx and ocl expression. (C-H) Confocal section of double in situ/immunolabelling with tlx or ocl mRNAs and EGFP in the Tg(gfap:gal4); Tg(uas:egfp) line labelling NSCs in the hindbrain. When miR-9 is not expressed broadly throughout the brain at 24 hpf, we observed an overlap in the expression of tlx and ocl with the NSCs marker GFAP (C, D). At 48 hpf, when miR-9 is strongly expressed in the brain ocl is excluded from the NSCs domain (E, F). At 72 hpf, both tlx and ocl are not detected in NSCs (G, H). Arrowheads show co-localization with EGFP. Dorsal view of the brain with anterior up. Scale bars: 100 μm.