
Image
|
Figure Caption
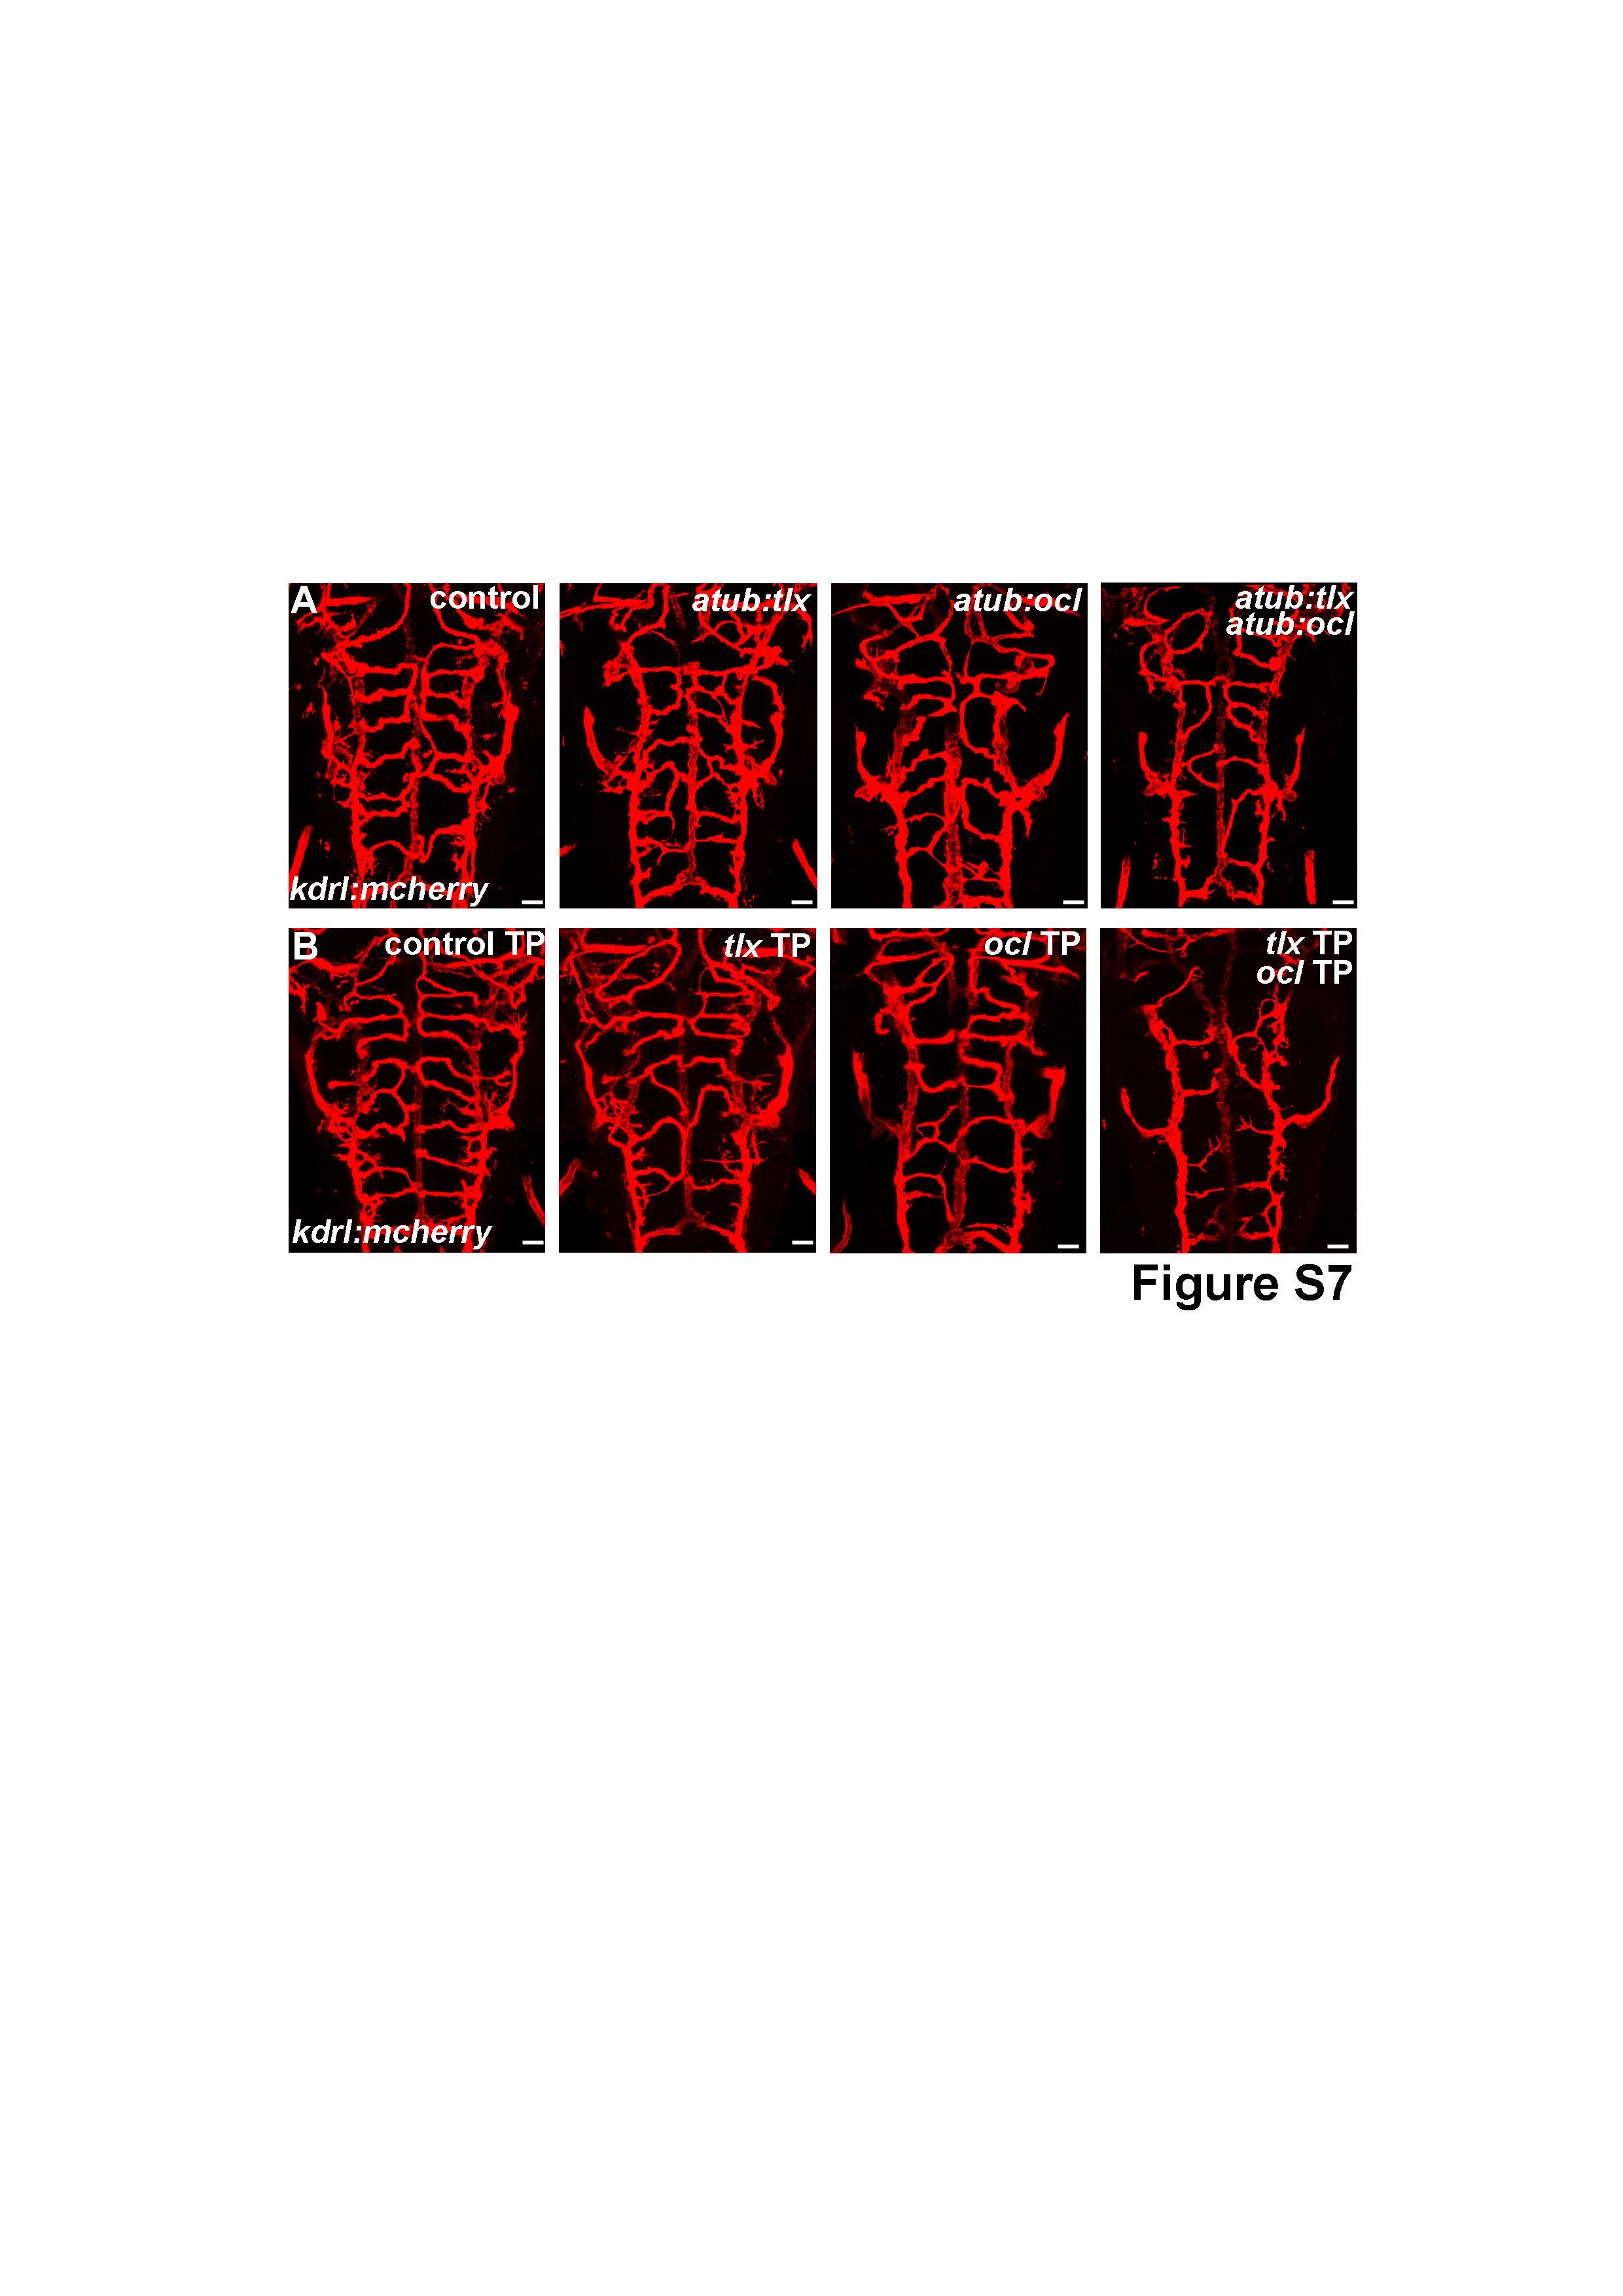
Fig. S7
Tlx and Ocl neuronal expression affect vasculature development (related to Figure 4)
(A) Confocal projections of mCherry immunolabelling in Tg(kdrl:mCherry) at 72 hpf showing blood vessels formation in the hindbrain of controls or larvae expressing uas:tlx, uas:ocl or uas:tlx and uas:ocl in a pan-neuronal manner in Tg(alpha-tubulin:gal4) line. (B) Confocal projections of mCherry immunolabelling in Tg(kdrl:mCherry) at 72 hpf showing blood vessels formation in the hindbrain of control MO, tlx TP, ocl TP or tlx and ocl TP larvae. Dorsal view of the brain with anterior up. Scale bars: 10 μm.
Acknowledgments
This image is the copyrighted work of the attributed author or publisher, and
ZFIN has permission only to display this image to its users.
Additional permissions should be obtained from the applicable author or publisher of the image.
Full text @ Cell Rep.