
|
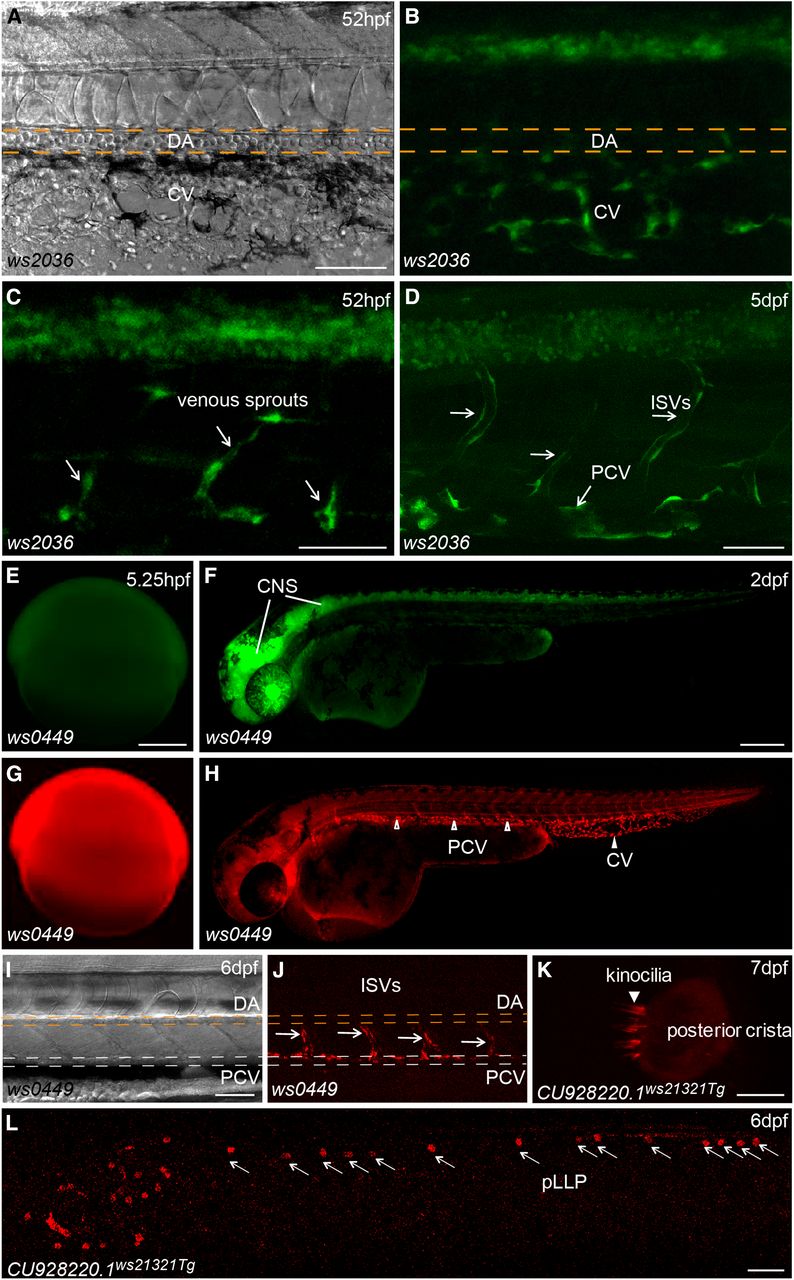
Fig. 4
Tissue-specific expression patterns may reveal activities of trapped loci. (A–D) Bright field (A) and fluorescent images of Tg(DsDELGT4)ws2036 embryos at 52 hr after fertilization (A–C), and 5 d after fertilization (D). Arrows show GFP expression in venous sprouts from posterior cardinal vein (C) and inter-segmental veins (ISVs) (D). (E–J) Bright field (I) and fluorescent images of Tg(DsDELGT4)ws0449 embryos at 5.25 hr after fertilization (E, G), 2 d after fertilization (F, H), and 6 d after fertilization (I, J). GFP expresses in CNS and mCherry expresses in posterior cardinal vein (PCV), caudal vein (CV) (arrowheads in H), and intersegmental veins (arrows in J), but not in dorsal aorta (DA in J). (K, L) Fluorescent images of a CU928220.1ws21321Tg embryo with mCherry expression in the inner ear of a larva 7 d after fertilization (K, arrowhead) and in neuromasts of the posterior lateral line primordium (pLLP) (L, arrows) at 6 d after fertilization. Scale bars, 50 µm in (A, C, D, E, I), 250 µm in (F) and (L), and 10 µm in (K).