
Image
|
Figure Caption
Fig. S1
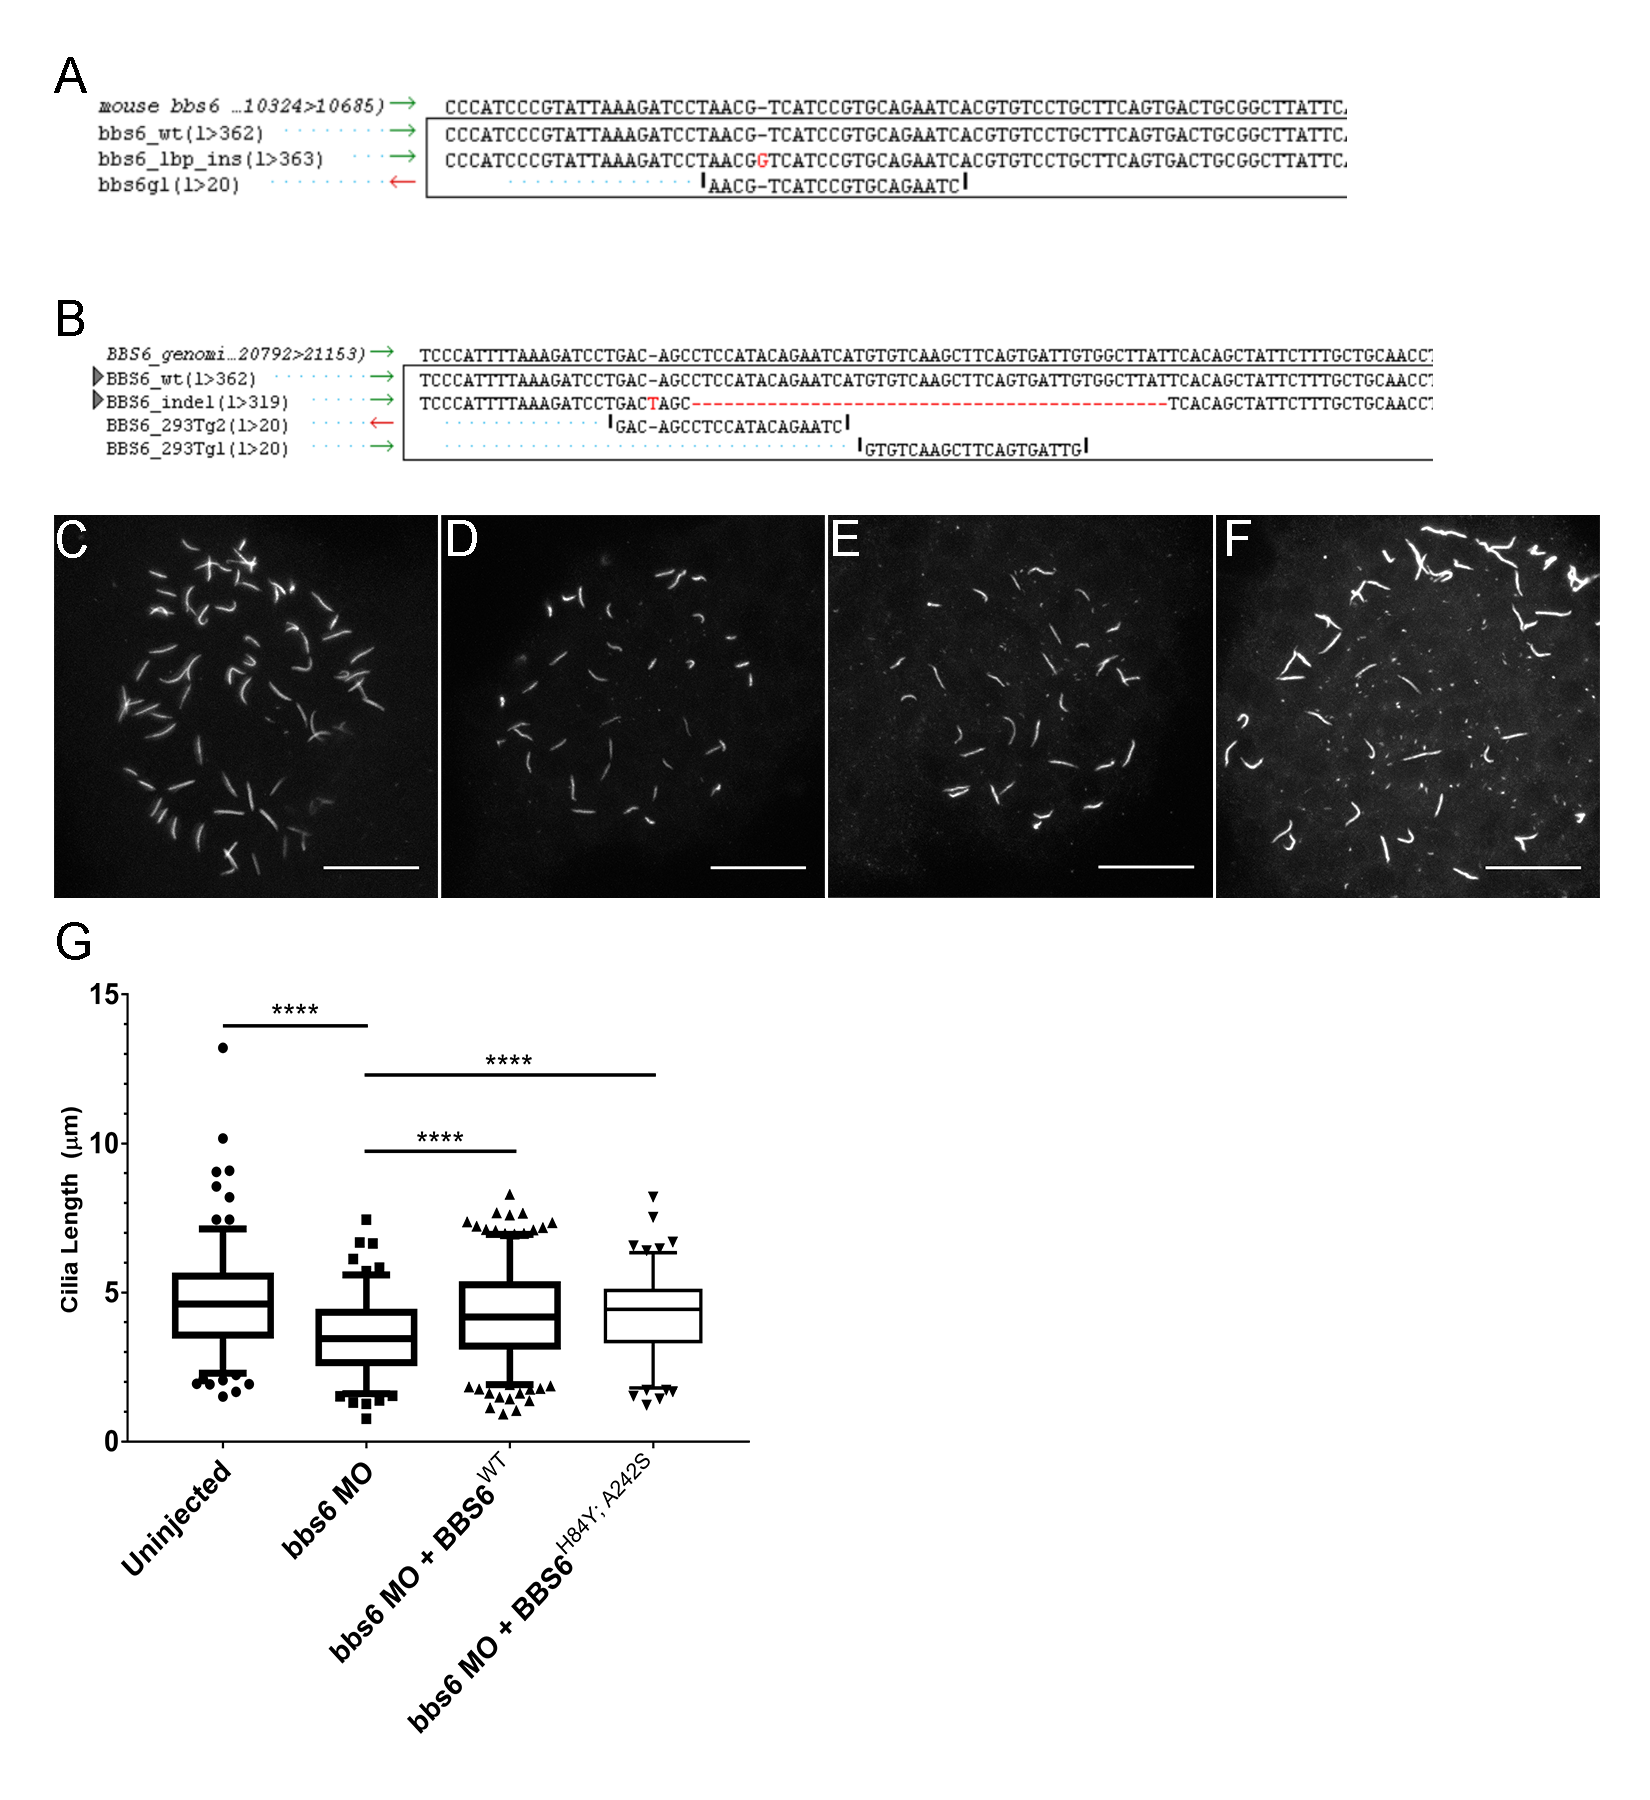
BBS6 knockout HEK 293T and IMCD3 cell lines and zebrafish bbs6 knockdown.
Alignments showing the indels generated by CRISPR/Cas9 in mIMCD-3 cells (A) and HEK 293T cells. Alignment shows reference genome, wildtype control, generated mutant line, and guide(s) used for targeting (B). Cilia lengths were measured in control (C), bbs6 morphants (D), morphants with overexpression of BBS6 (E), or BBS6H84Y; A242S (F). Box and whisker plot representing the 5–95 percentiles of the collected data; n = 128–288 per group (G).
Figure Data
Acknowledgments
This image is the copyrighted work of the attributed author or publisher, and
ZFIN has permission only to display this image to its users.
Additional permissions should be obtained from the applicable author or publisher of the image.
Full text @ PLoS Genet.