
|
Fig. 8
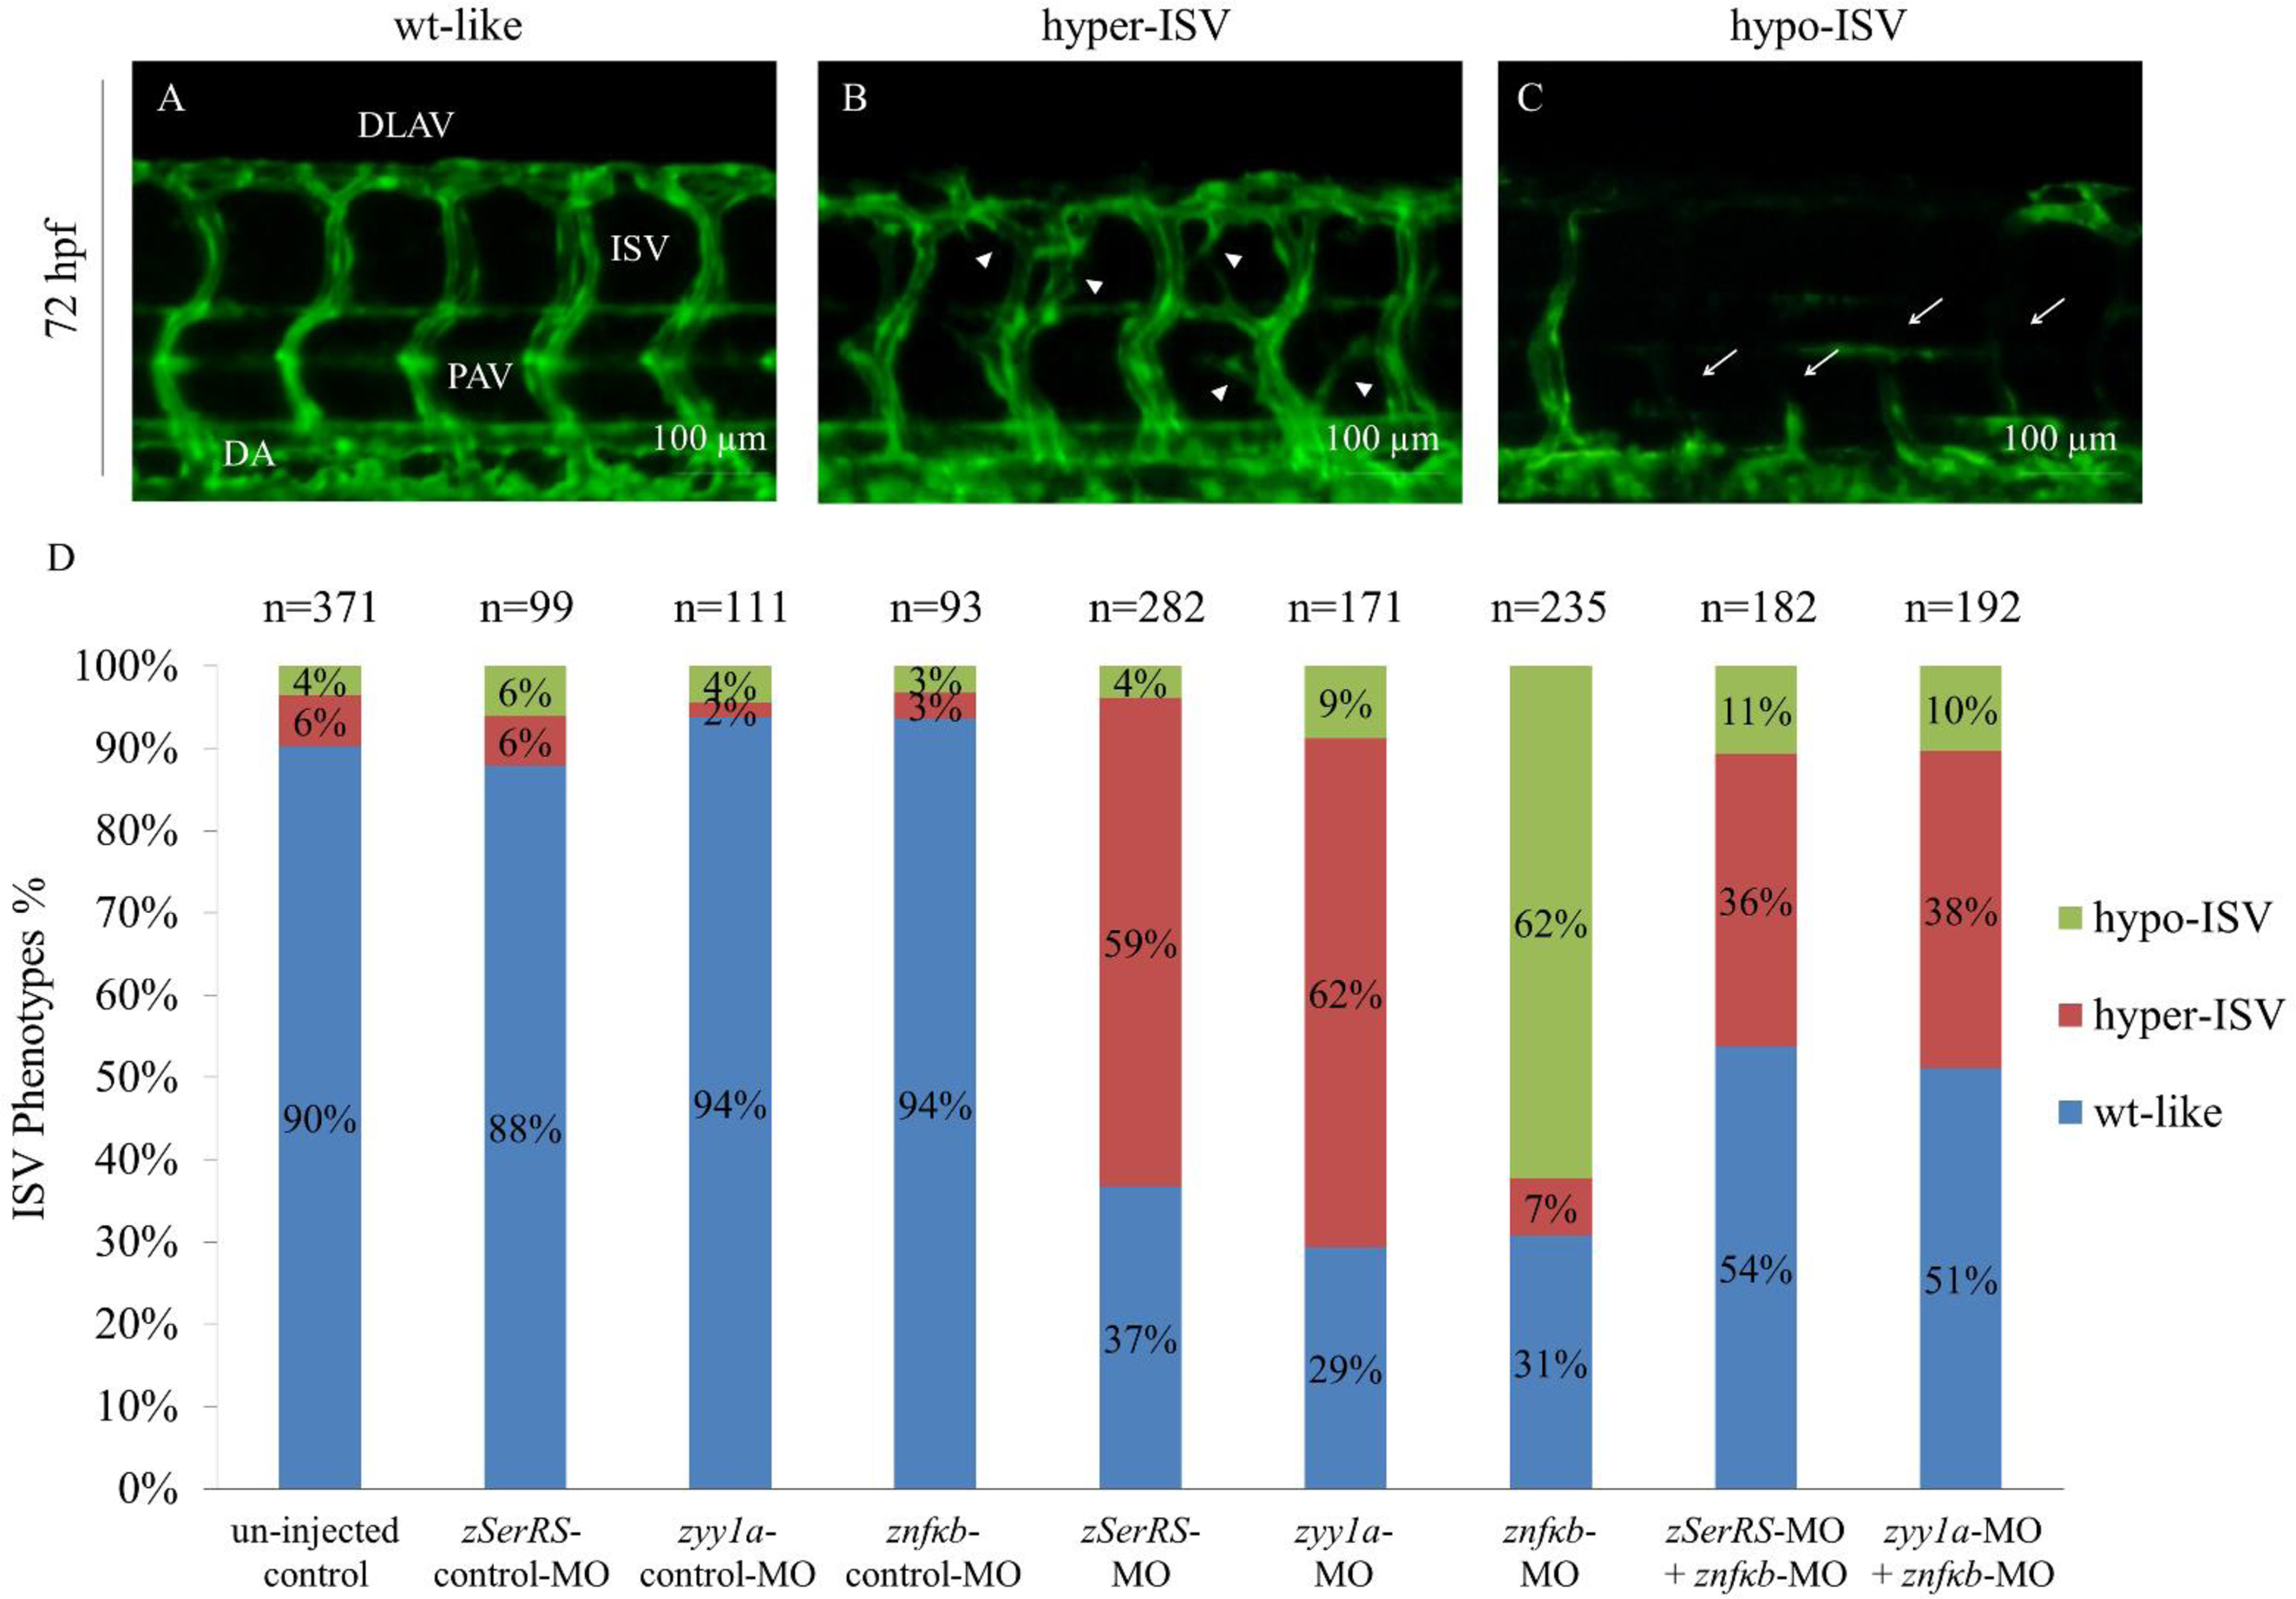
The effects of SerRS, YY1 and NFKB1 on vascular development in zebrafish embryos. The percentages of Tg(fli1:EGFP)y1 embryos exhibiting ISV phenotypes at 72 hpf were counted. Different MOs were injected to specifically knock down the expressions of zebrafish SerRS, yy1a and nfkb, including un-injected control (n = 371), zSerRS-control-MO (4 ng; n = 99), zSerRS-MO (4 ng; n = 282), zyy1a-control-MO (3 ng; n = 111), zyy1a-MO (3 ng; n = 171), znfkb-control-MO (4 ng; n = 93), znfkb-MO (4 ng; n = 235), znfkb-MO (4 ng) plus zSerRS-MO (4 ng) (n = 182), and znfkb-MO (4 ng) plus zyy1a-MO (3 ng) (n = 192). The ISV angiogenesis of Tg(fli1:EGFP)y1embryos was observed under fluorescence microscope at 72 hpf. Three different levels of ISV angiogenesis in embryos were categorized: (A) wild-type-like (wt-like), (B) hypo-phenotype (hypo-ISV, white arrowheads) and (C) hyper-phenotype (hyper-ISV, white arrows). (D) The occurrence of different ISV phenotypes in each group, as indicated, was calculated in percentage of the total number (n) of examined embryos. DLAV: dorsal longitudinal anastomotic vessels; PAV: parachordal vessels; DA: dorsal aorta; ISV: intersegmental vessels. Scale bar: 100 μm.