
|
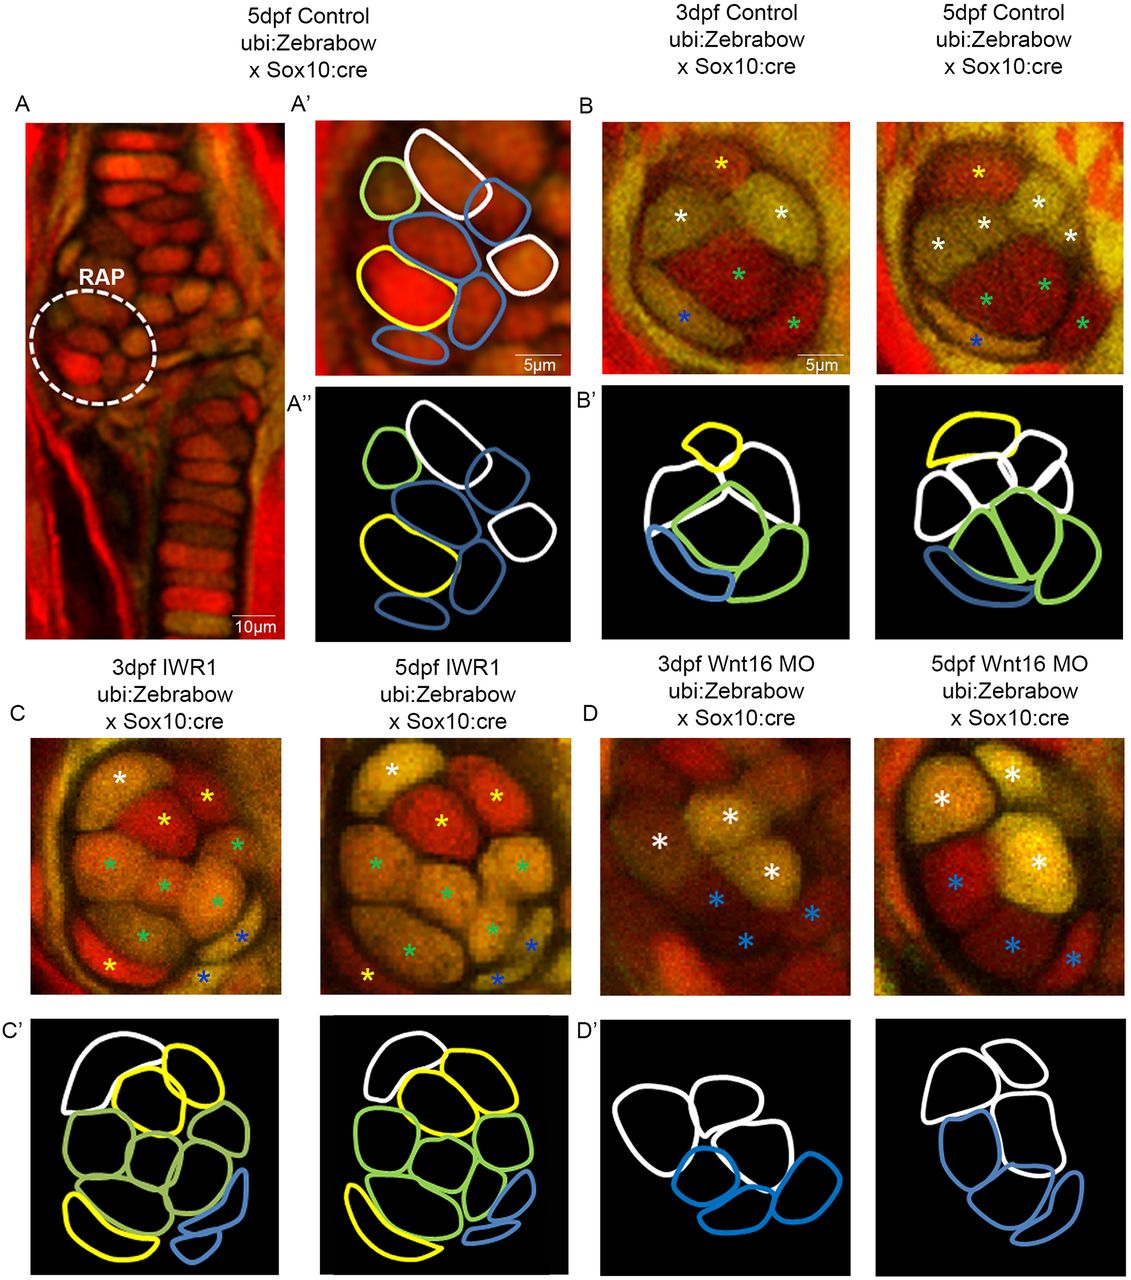
Fig. 5
Wnt manipulation affects cell proliferation and cell morphology at the jaw joint, revealed using the Zebrabow transgenic line. (A-A″): Tg(ubi:Zebrabow) and Tg(Sox10:cre) transgenic lines generate multiple colours of fluorescence in zebrafish cartilage, including at the region of interest at the retroarticular process (RAP) (white dotted line). Cell outlines were created at the RAP: (A′) RAP cell outlines overlaid with confocal image; (A″) cell outlines. (B,C,D) 3 and 5 dpf Tg(ubi:Zebrabow) and Tg(Sox10:cre) control (B), IWR-1-treated (C) and Wnt16 MO-injected zebrafish (D) (n=10, 11 and 20 joints). The RAP of the MC jaw joint is shown. Asterisks of different colours mark cells at 3 and 5 dpf (indicating re-identification and cell division events). (B′,C′,D′) Outlines of individual cells in the RAP of the MC jaw joint, identified in control (B′), IWR-1-treated (C′) and Wnt16 MO-injected (D′) Tg(ubi:Zebrabow) and Tg(Sox10:cre) transgenic zebrafish. Outline colour of individual cells in B′,C′,D′ matches the asterisk colours in B,C,D.