
|
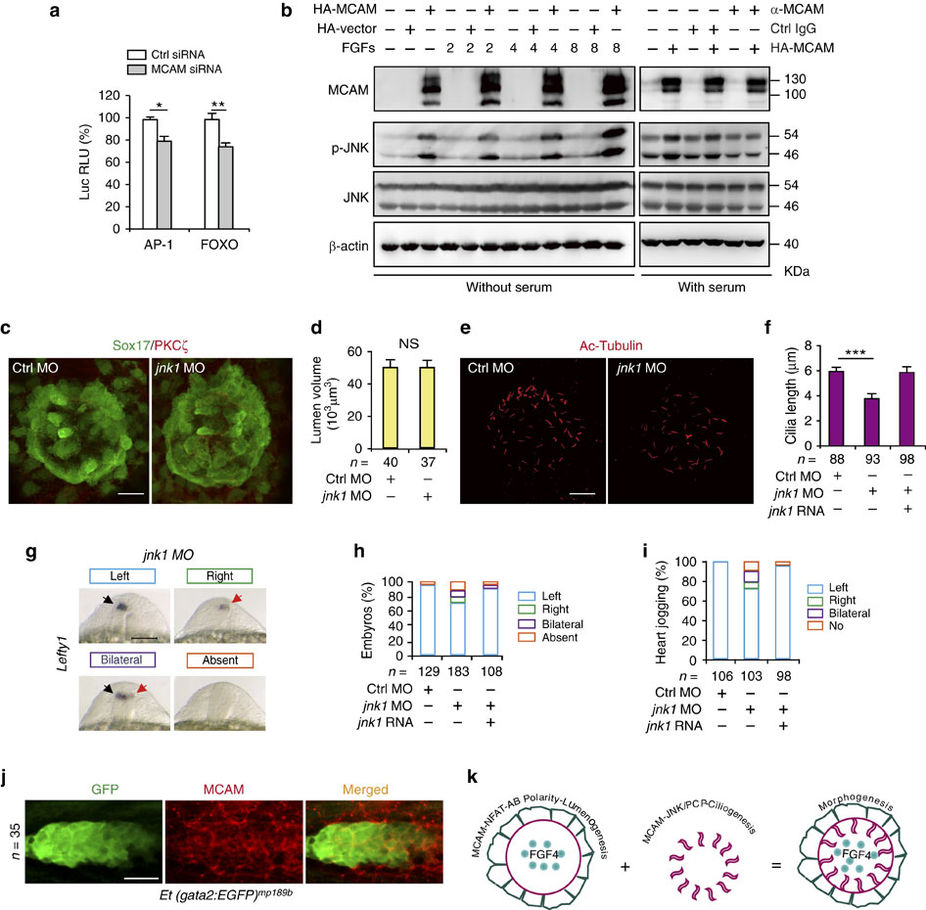
Fig. 7
MCAM-dependent JNK activation regulates ciliogenesis.
(a) Luciferase activity measured 30 h post transfection. AP-1-Luc or FOXO-Luc reporter vectors were co-transfected with either MCAM RNAi or control RNAi. Data (mean±s.e.m.) were analysed with unpaired student’s t-test. *P value<0.05 and **P value<0.01. (b) Phosphorylation and expression of JNK following overexpression of MCAM by transfection with pCS2-MCAM-HA or blockage of MCAM by its functional antibody AA98. (c,d) DFC-specific knockdown of jnk1 did not affect lumen formation in Sox17:GFP zebrafish embryos. Lumen cells were labelled with an antibody against aPKCζ (red). Scale bar, 20 μm. Data (mean±s.e.m.) were analysed with unpaired student’s t-test. The NS means not significant. (e,f) DFC-specific knockdown of jnk1 shortened KV cilia. The cilia were labelled with acetylated tubulin antibody. Scale bar, 20 μm. Data (mean±s.e.m.) were analysed using one-way ANOVA with Tukey’s post-test. ***P value<0.001. (g,h) Randomized expression of left side-specific lefty1 in the DFCjnk1 MO morphants. Scale bar, 100 μm. (i) Quantitative analysis of embryos with normal (left-sided), reversed (right-sided), cardia bifida (bilateral) and absent expression. n, number of embryos (d,f,h,I,j). (j) MCAM is localized at the zebrafish PLL system. Embryos of Et (gata2:EGFP) mp189b zebrafish line at the 28 h.p.f. stage were collected and stained with MCAM antibody. Scale bar, 15 μm. (k) A model of MCAM-mediated coordination of cell polarity during morphogenesis. See text for details.