
|
Fig. 3
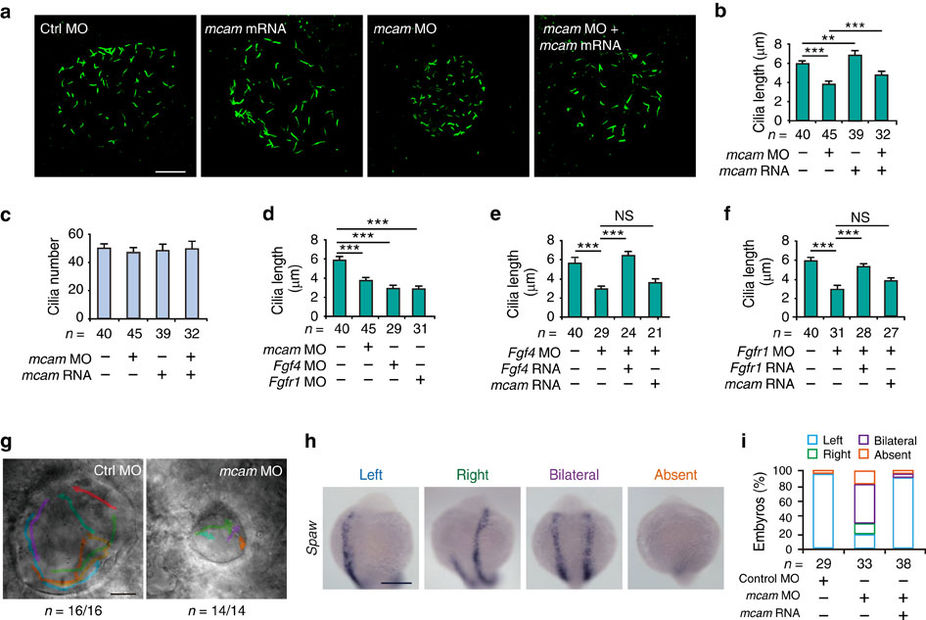
Mcam depletion in DFC disrupts ciliogenesis and direction of KV fluid flow in zebrafish.
(a) KV cilia labelled with an antibody against acetylated tubulin after DFC injection of embryos with control or mcam MO, mcam mRNA or a combination of mcam MO and mRNA. Scale bar, 20 μm. (b) Mean cilia length in (a) is statistically analysed. Data are presented as mean±s.e.m. One-way ANOVA with Tukey’s post-test. **P value<0.01 and ***P value<0.001. (c) Mean cilia number (mean±s.e.m.) of embryos in a was determined. (d) Comparison of cilia length in embryos with DFC injection of mcam, fgf4 or fgfr1 MO. Data are presented as mean±s.e.m. One-way ANOVA with Tukey’s post-test. ***P value<0.001. (e,f) Failure of mcam mRNA to rescue fgf4 MO (e) or fgfr1 MO (f) induced reduction in cilia length. Data are presented as mean±s.e.m (n=3) and analysed using one-way ANOVA with Tukey’s post-test. ***P value<0.001 and NS, not significant. (g) Direction of KV fluid flow tracked with fluorescent beads in control and DFCmcam MO embryos. Scale bar, 20 μm. (h) Randomized expression of left side-specific spaw in DFCmcam MO morphants. Scale bar, 250 μm. (i) Quantitative analysis of embryos with normal (left-sided), reversed (right-sided), cardia bifida (bilateral) and absent expression. n, number of embryos (b-f, i).