
Image
|
Figure Caption
Fig. 2 S1
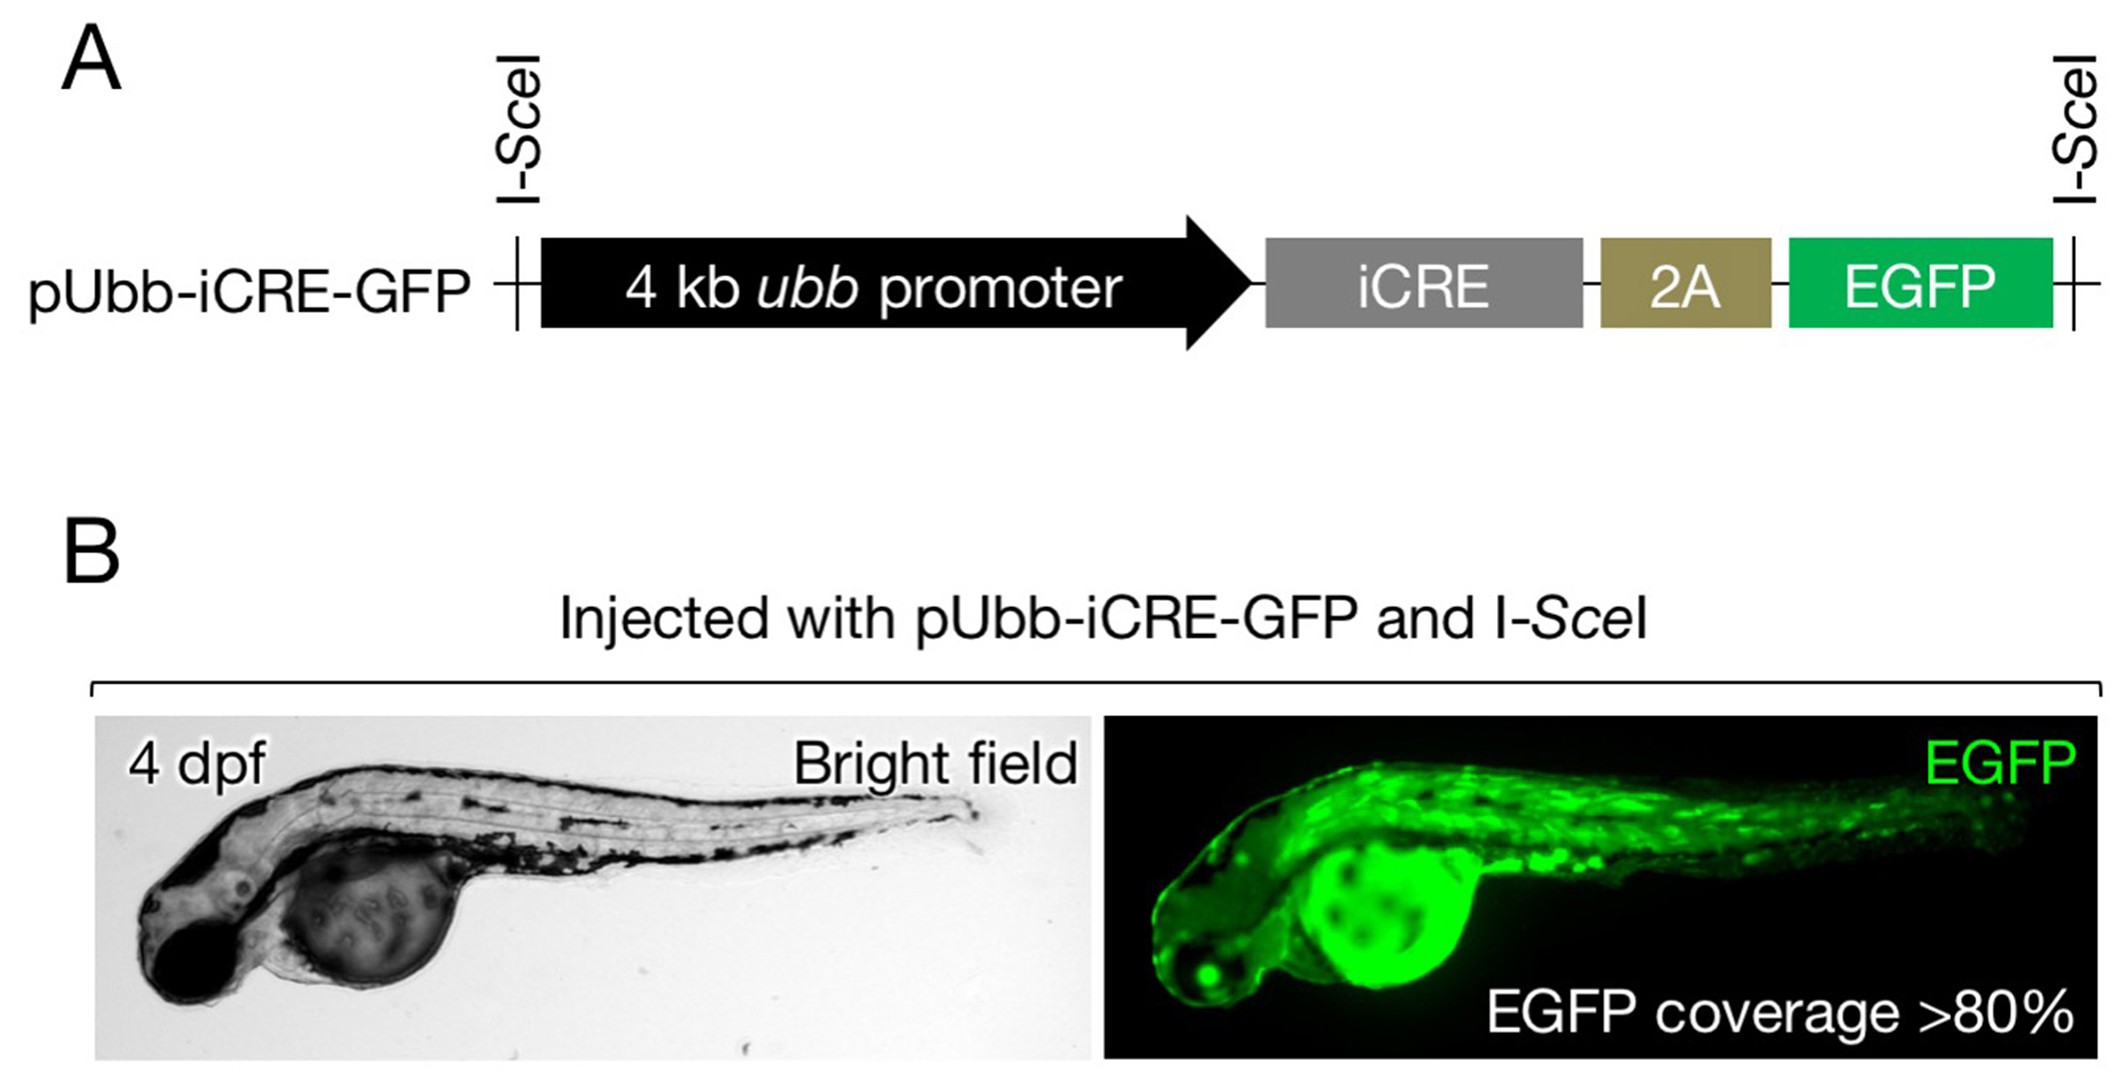
Cre expression vector.
(A) Schematic of pUbb-iCRE-GFP. (B) A representative image of embryos injected with pUbb-iCRE-GFP expressing EGFP (right) on approximately 80% of the body surface (left). Embryos expressing EGFP at similar or greater levels were selected for the analysis presented in Figure 3A–C.
Acknowledgments
This image is the copyrighted work of the attributed author or publisher, and
ZFIN has permission only to display this image to its users.
Additional permissions should be obtained from the applicable author or publisher of the image.
Full text @ Elife