
Fig. 3
|
Fig. 3
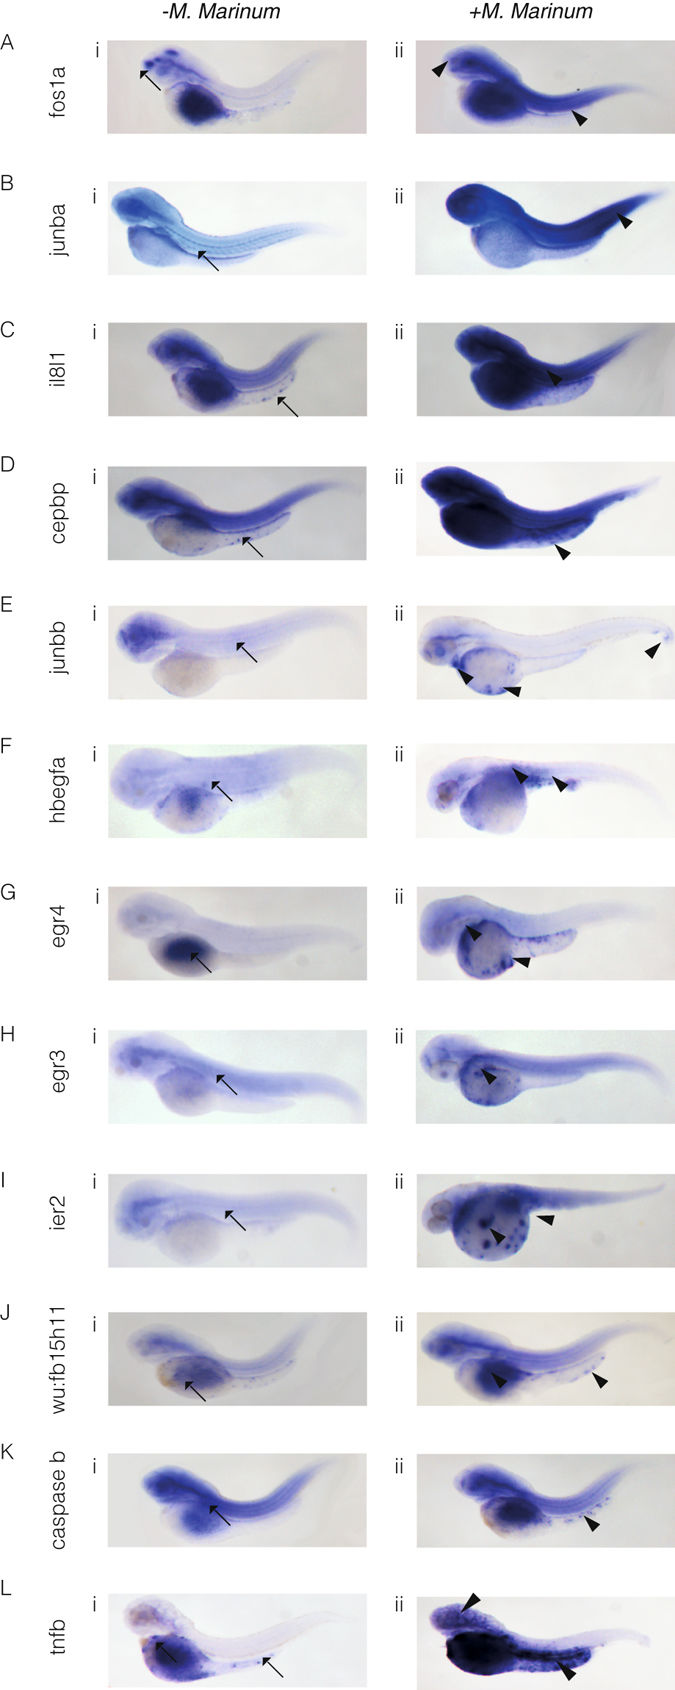
In situ hybridisation reveals spatial analysis of M. marinum-induced upregulated genes. Embryos were injected at the 32-512-cell stage with M. marinum. Expression patterns and gene transcript levels were analysed by in situ hybridisation using digoxigenin-labelled RNA probes, in uninjected controls (A–Li) and M. marinum-injected embryos (A–Lii). Control expression patterns are indicated by the black arrows with black arrowheads used to indicate altered expression patterns for fos1a (A), junba (B), il81a (C), cepbp (D), junbb (E), hbegfa (F), egr4 (G), egr3 (H), ier2 (I), wu:fb15h11 (J), caspase b (K) and tnfb (L).