
Image
|
Figure Caption
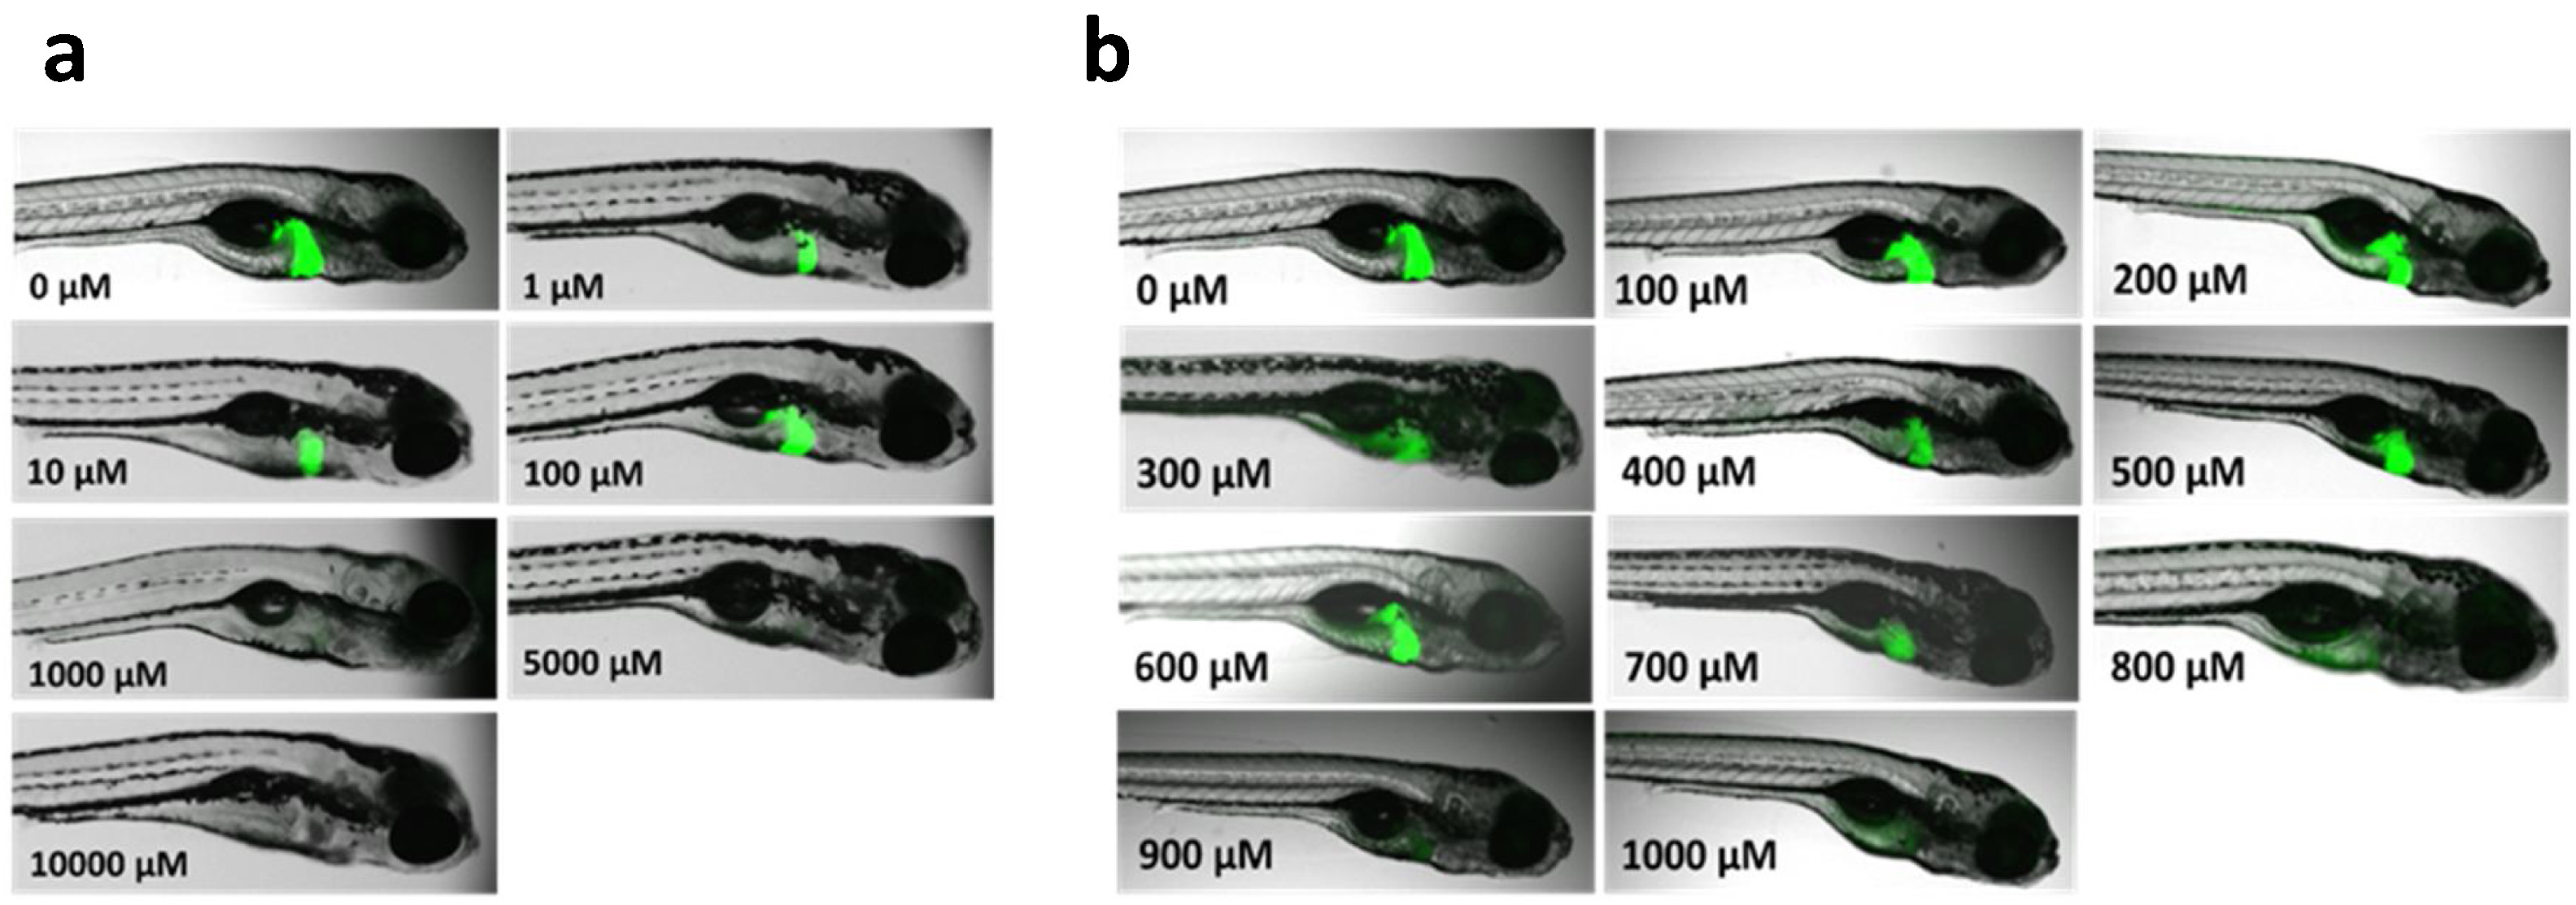
Fig. 2
Dose-response of Tg(l-fabp:CFP-NTR)s891 zebrafish embryos exposed to metronidazole (MTZ) at 96 hpf, and imaged at 120 hpf, at a broad (a) and refined (b) range of MTZ concentrations. Ablation of hepatocytes was assessed based on visible green fluorescent signal, where a decreasing fluorescent signal indicates hepatocyte ablation.
Acknowledgments
This image is the copyrighted work of the attributed author or publisher, and
ZFIN has permission only to display this image to its users.
Additional permissions should be obtained from the applicable author or publisher of the image.
Full text @ Toxicol Rep