
|
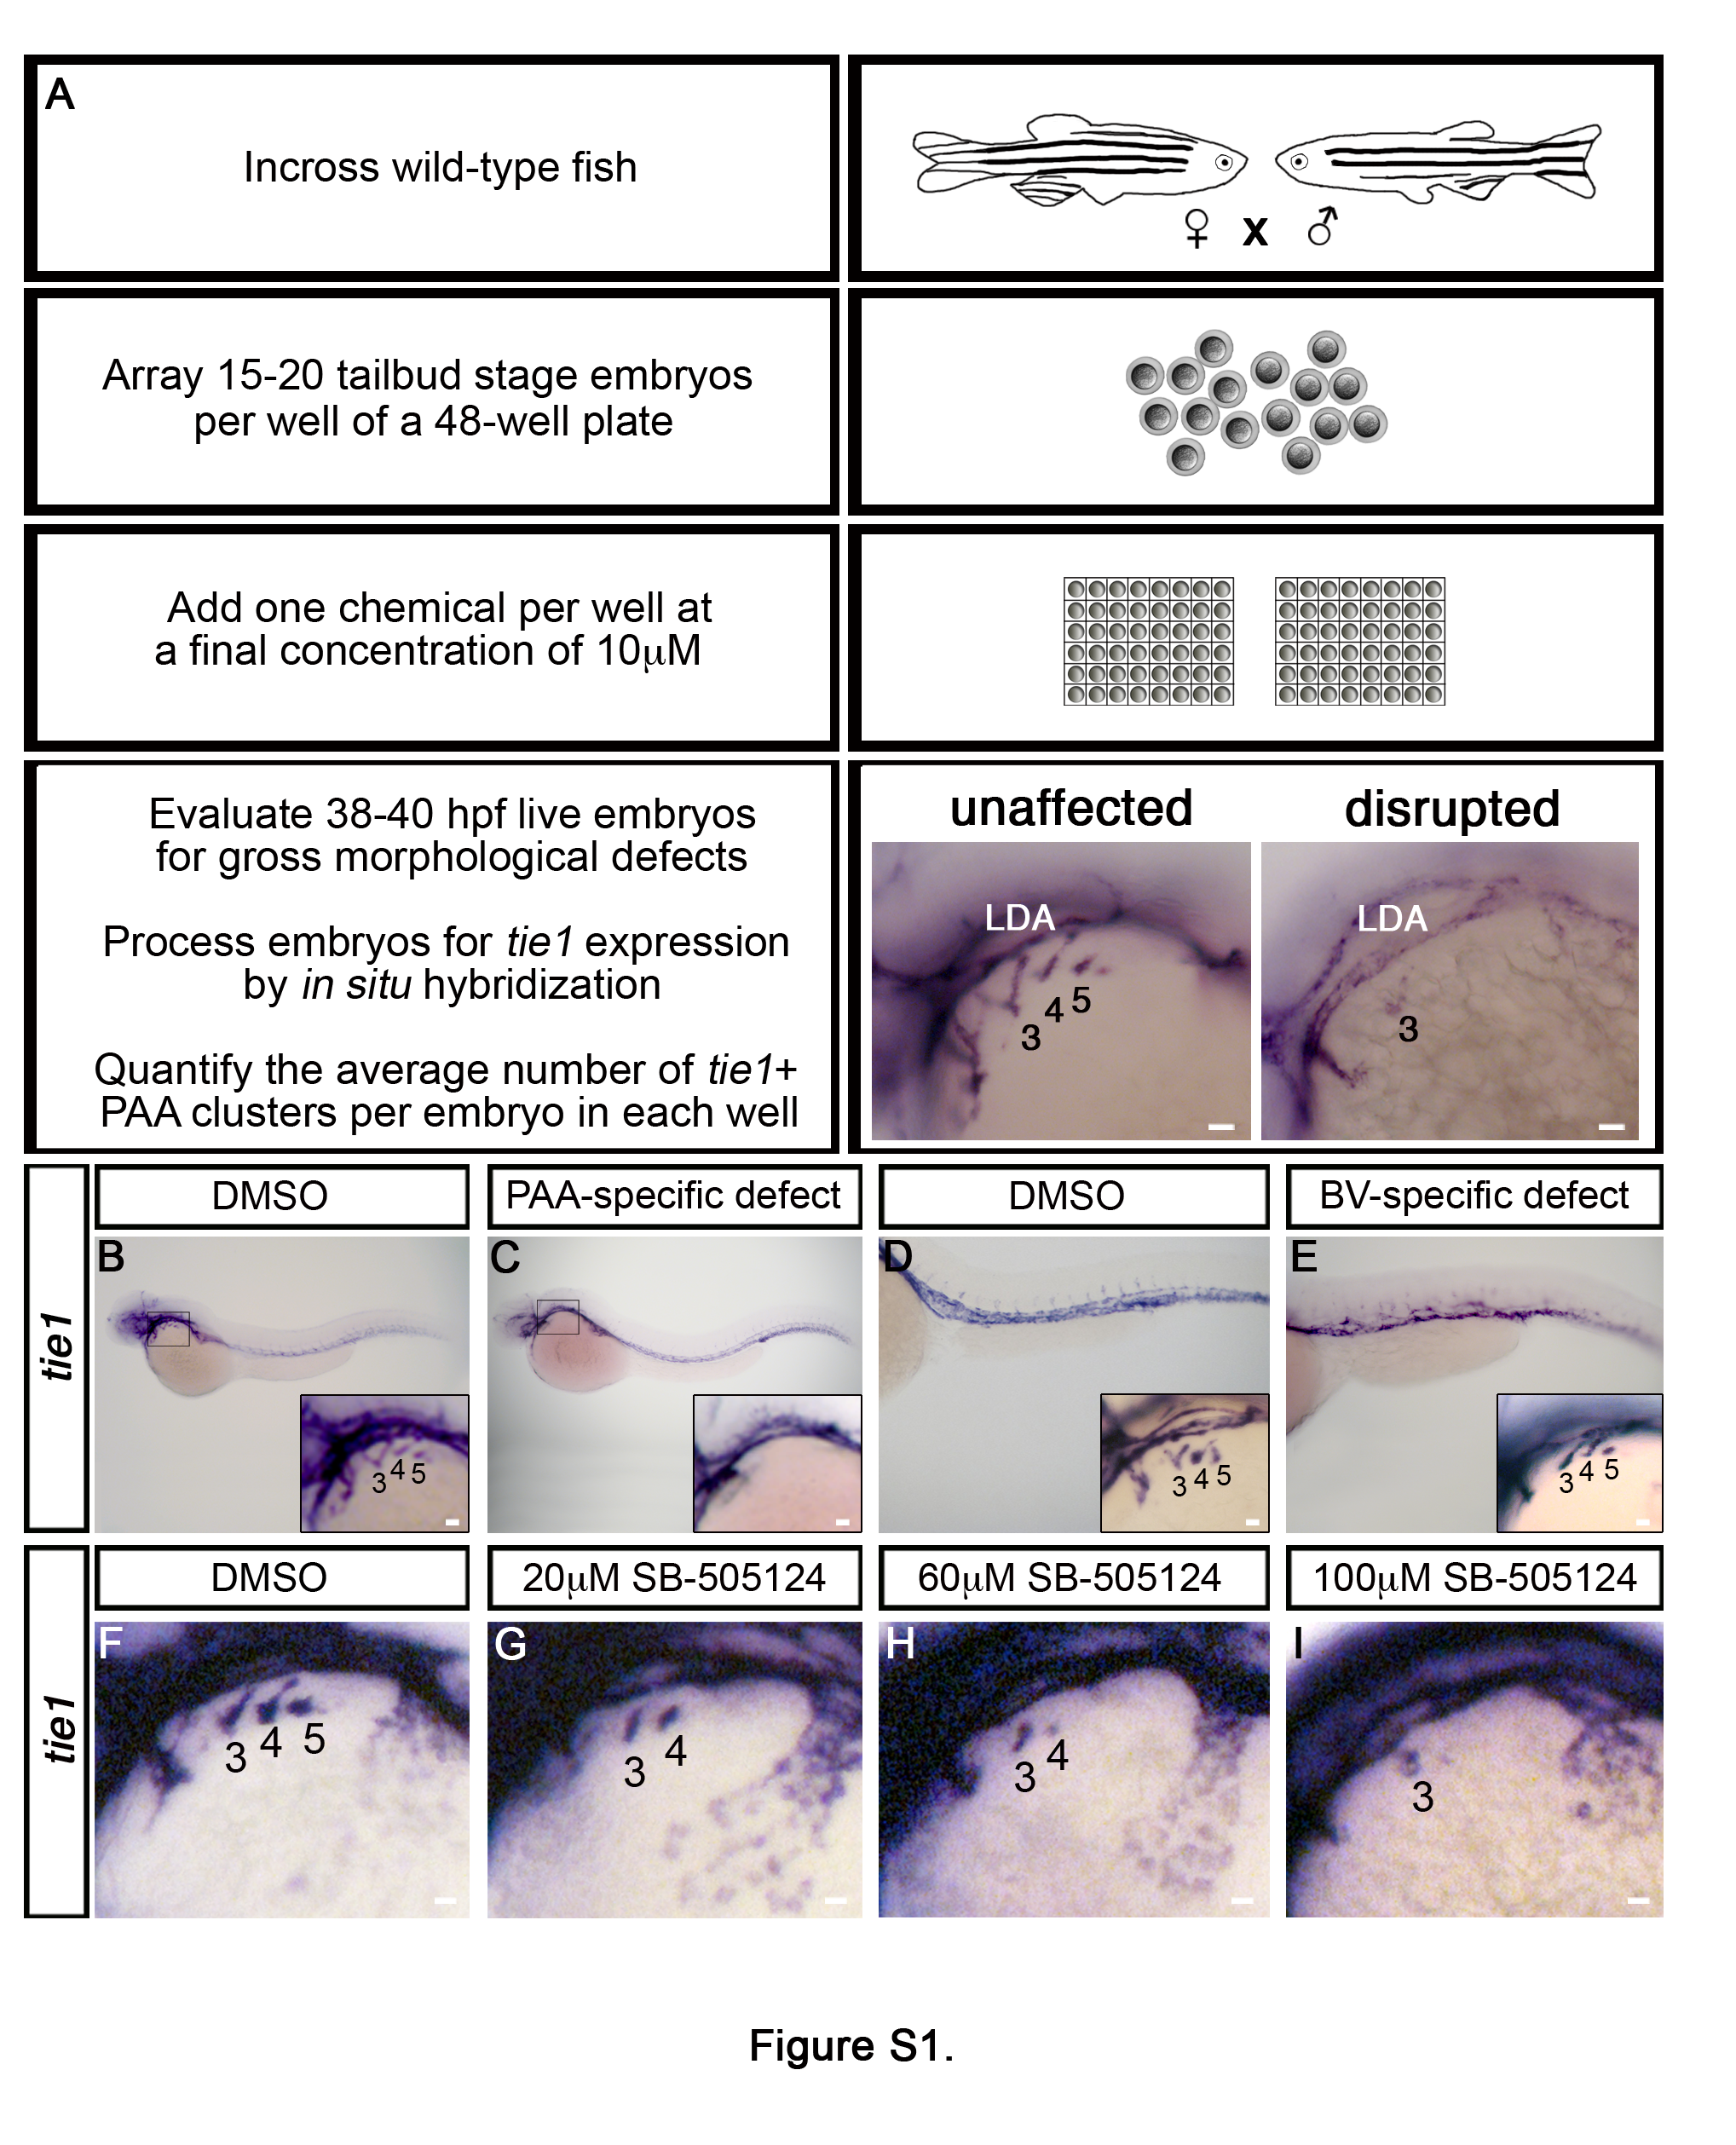
Fig. S1
Chemical screening in zebrafish identifies the TGFβ pathway as required for PAA development, Related to Figure 1.
(A) Flow diagram depicting the strategy for a small molecule screen designed to uncover novel pathways that regulate tie1+ PAA angioblast development. Left lateral views of PAA angioblast clusters visualized by whole mount in situ hybridization for tie1 in 36-38 hours post fertilization (hpf) embryos treated from bud stage with vehicle control (DMSO) or 10μM small molecule. The angioblast clusters are numbered as shown according to the pharyngeal arches within which they form. (B,C) Left lateral views of whole embryos and higher magnification views of PAA angioblast clusters (inset) following chemical treatment and in situ hybridization for tie1. Embryos with PAA-specific defects were observed (C) as compared to controls (B). (D,E) Left lateral views of trunk and tail regions of embryos and higher magnification views of PAA angioblast clusters (inset) following chemical treatment and in situ hybridization for tie1. Embryos with body vasculature (BV) defects but normal PAA angioblast clusters were observed (E) in comparison to controls (D). (F-I) Left lateral views of tie1+ PAA angioblasts in 38 hpf embryos treated from 20 hpf with DMSO (F, n=19) or the indicated, increasing concentrations of SB- 505124 (G, 20μM, n=20; F, 60μM, n=28; G, 100μM, n=21).