
|
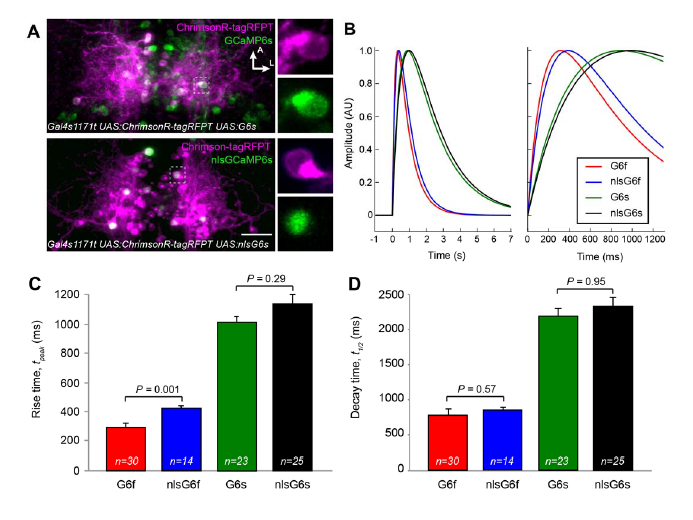
Fig. S6
Comparison of cytoplasmic and nuclear GCaMP6 variants. (A) GCaMP6 dynamics were measured in nMLF cells (Gal4s1171t) transiently expressing ChrimsonR-tagRFP and either of the GCaMP6 variants. Single cells were photostimulated with 200 ms of 760 nm light and the GCaMP transients were measured by ~300 Hz line scans across the soma of the stimulated cell. Single-channel closeups shown on the right of the regions indicated by dashed boxes, show membrane, cytoplasmic, or nuclear localization of ChrimsonR-tagRFP, GCaMP6s or nls-GCaMP6s, respectively. G6s, GCaMP6s; G6f, GCaMP6f. Scale bar, 30 μm. (B) Normalized mathematical fit for the fluorescence responses of all measured GCaMP6 versions. Number of trials (n) is indicated in (C) and (D). (C) Comparison of fluorescence rise times to peak intensity. (D) Comparison of half decay times. Error bars indicate SEM.