
|
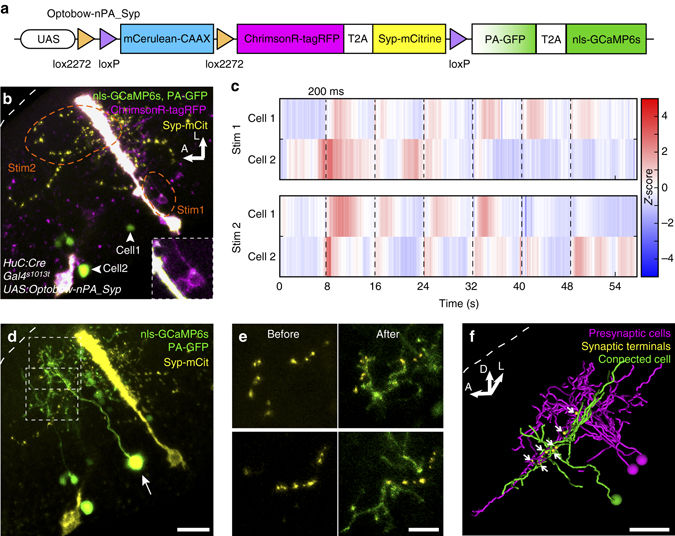
Fig. 4
Optobow-nPA_Syp reveals potential synaptic contacts. a In Optobow-nPA_Syp, ChrimsonR-expressing cells are co-labeled by Synaptophysin-mCitrine. b Tectal-specific expression of Optobow-nPA_Syp. Cell bodies of two ChrimsonR-expressing cells (magenta, close-up in lower right, Stim1) or neuropil regions (Stim2), respectively, were stimulated (orange dashed line), and activity of two nls-GCaMP6s-expressing cells (arrowheads) was monitored. Note that a radial glia cell overexpressing ChrimsonR-tagRFP and Syp-mCitrine appears in white. c Z-scores of calcium measurements for cell#1 and cell#2 during cell body (Stim1) or neuropil stimulations (Stim2). Photostimulation epochs of 200 ms are indicated by dashed lines. Cell#1 shows high response reliability. While cell#2 shows spontaneous activity during Stim1, its response correlates to neuropil stimulations suggesting that additional ChrimsonR-labeled cells were activated by Stim2. d Photoactivation of PA-GFP in cell#1 (arrow). Spectral unmixing was used to separate PA-GFP/GCaMP (green) from mCitrine signals (yellow; see Methods section). Scale bar, 20 µm. e Close-up on single confocal slices of the regions marked in d before and after PA-GFP photoactivation. Scale bar, 10 µm. f Three-dimensional filament reconstruction of presynaptic (magenta) and connected cells (green) in transverse view. Potential synapses, shown in yellow (arrows), are restricted to a single tectal layer. Scale bar, 20 µm