
|
Fig. 3
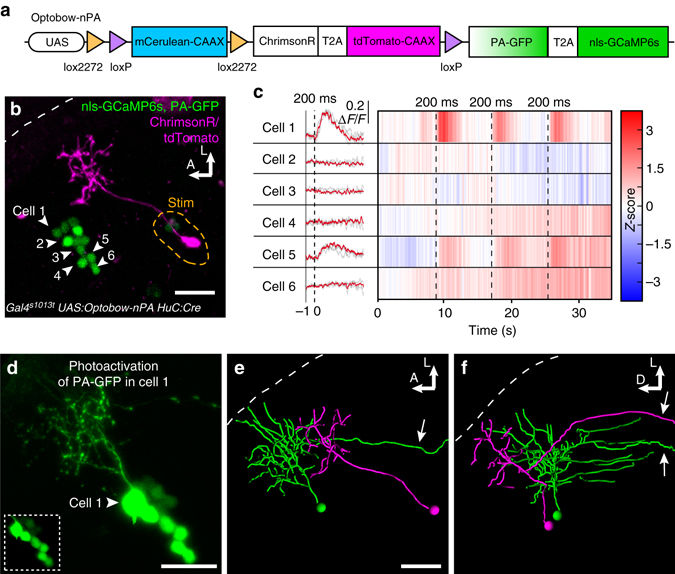
PA-GFP reveals morphologies of functionally connected cells. a In Optobow-nPA, all ‘nls-GCaMP6s’ cells co-express PA-GFP. b Optobow-nPA expression in the optic tectum. A single ChrimsonR-expressing cell (magenta) was photostimulated (orange dashed line) and GCaMP fluorescence was monitored in six neighbouring cells by line scans across the nuclei. Note that PA-GFP is not detectable before its activation. Scale bar, 20 µm. c Calcium measurements acquired at 250 fps for the GCaMP cells annotated in b. Raw (grey) and averaged ∆F/F responses (red) are shown on the left, heat maps for Z-scores are on the right. Photostimulation epochs of 200 ms are indicated by dashed lines. Cell#1 and #5 showed reliable calcium responses upon photostimulation. d Close-up of cell#1 after photoactivation of PA-GFP. A less saturated, single slice of the cell body region shown in the lower left demonstrates exclusive photoactivation of cell#1. Scale bar, 20 µm. e, f Three-dimensional filament reconstruction of the presynaptic cell (magenta) and cell#1 (green) in dorsal view (e) and transverse view (f). The presynaptic cell is a bistratified projection neuron, and cell#1 is a non-stratified projection neuron. Descending projection axons are marked (arrows). Scale bar, 20 µm