
Image
|
Figure Caption
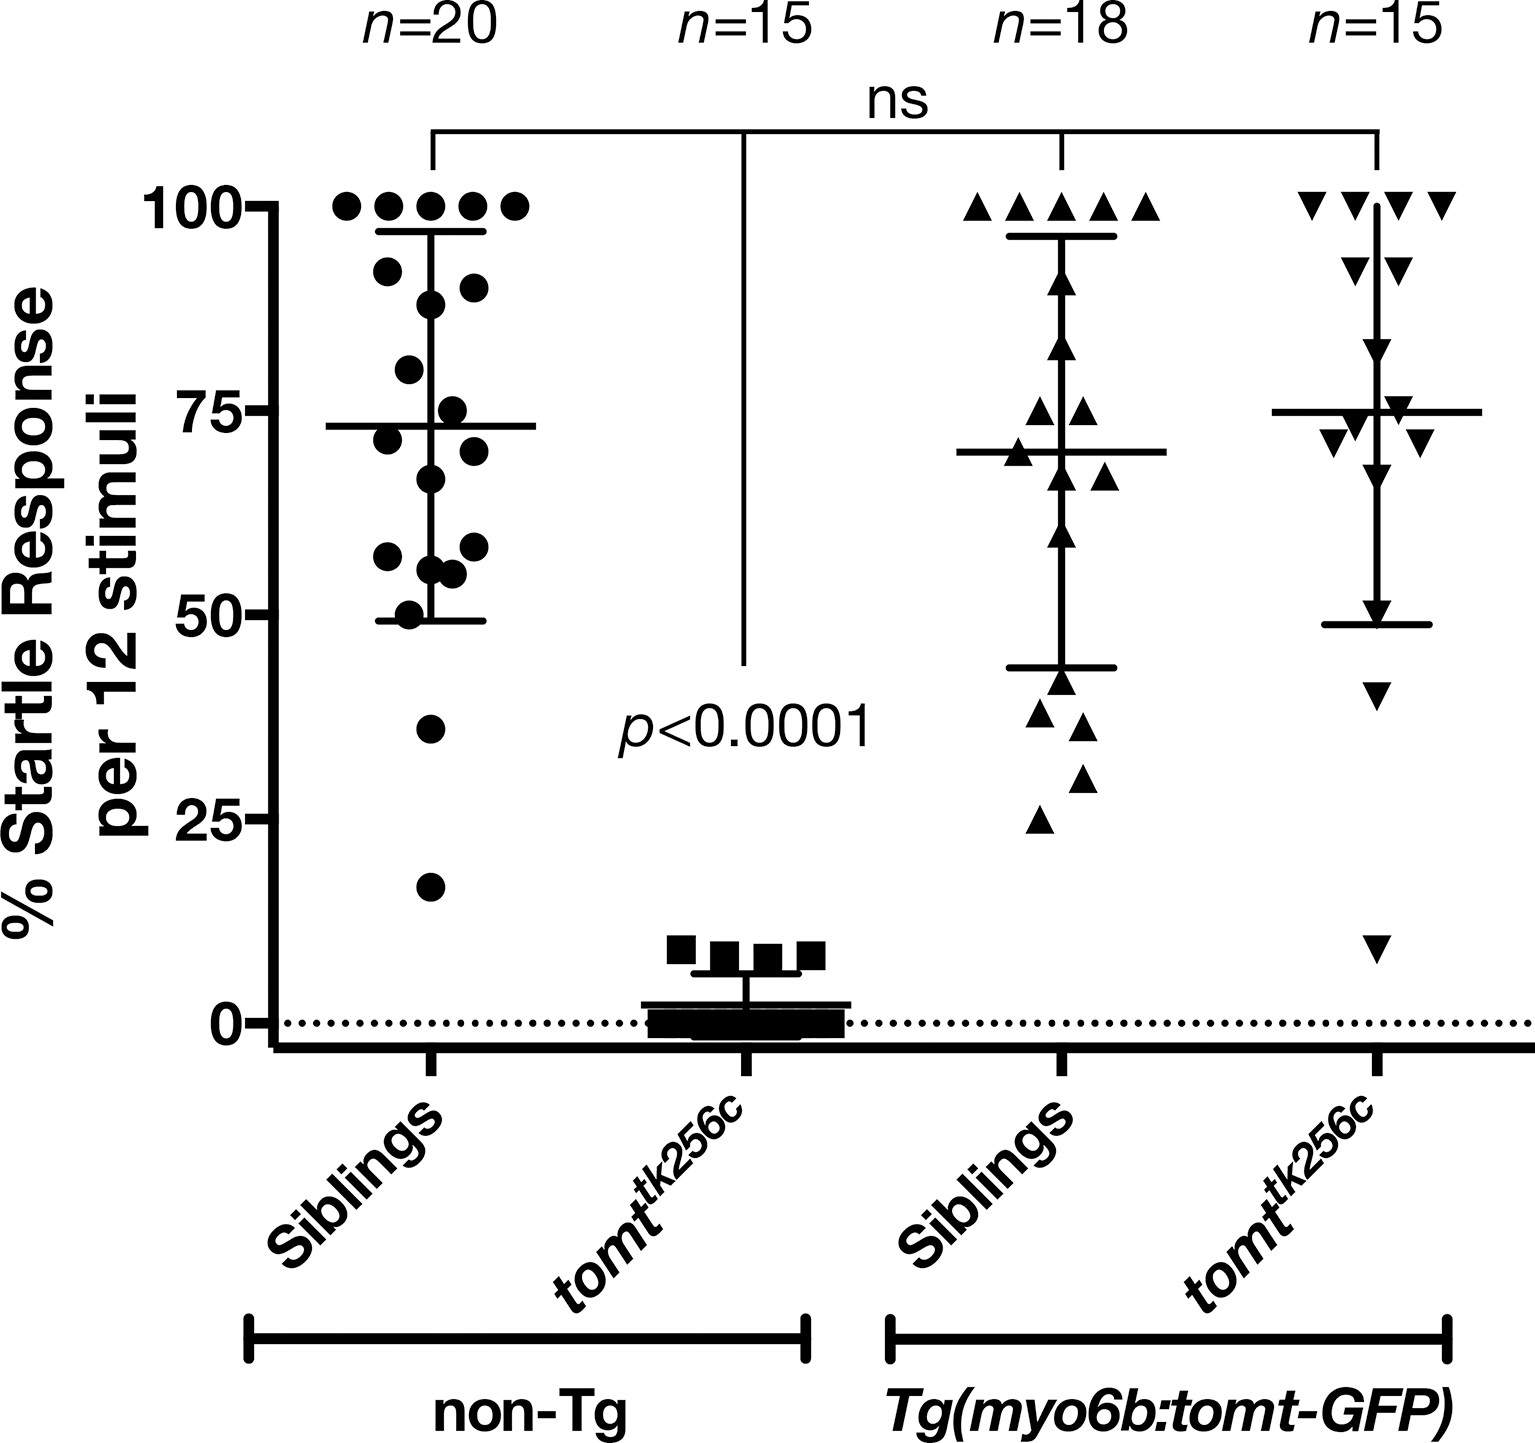
Fig. 3 Auditory evoked behavior response (AEBR) in 6 dpf tomttk256c siblings and mutants, with or without the myo6b:tomt-GFP transgene.
The genotype of each group is labeled below, and the number of individuals analyzed for each genotype shown above. Each data point represents the percent of startle responses per trial of 12 stimuli for an individual larva. Error bars show the mean ± SD. Statistical comparisons were made by one-way ANOVA with Bonferroni's multiple comparison test.
Figure Data
Acknowledgments
This image is the copyrighted work of the attributed author or publisher, and
ZFIN has permission only to display this image to its users.
Additional permissions should be obtained from the applicable author or publisher of the image.
Full text @ Elife