
|
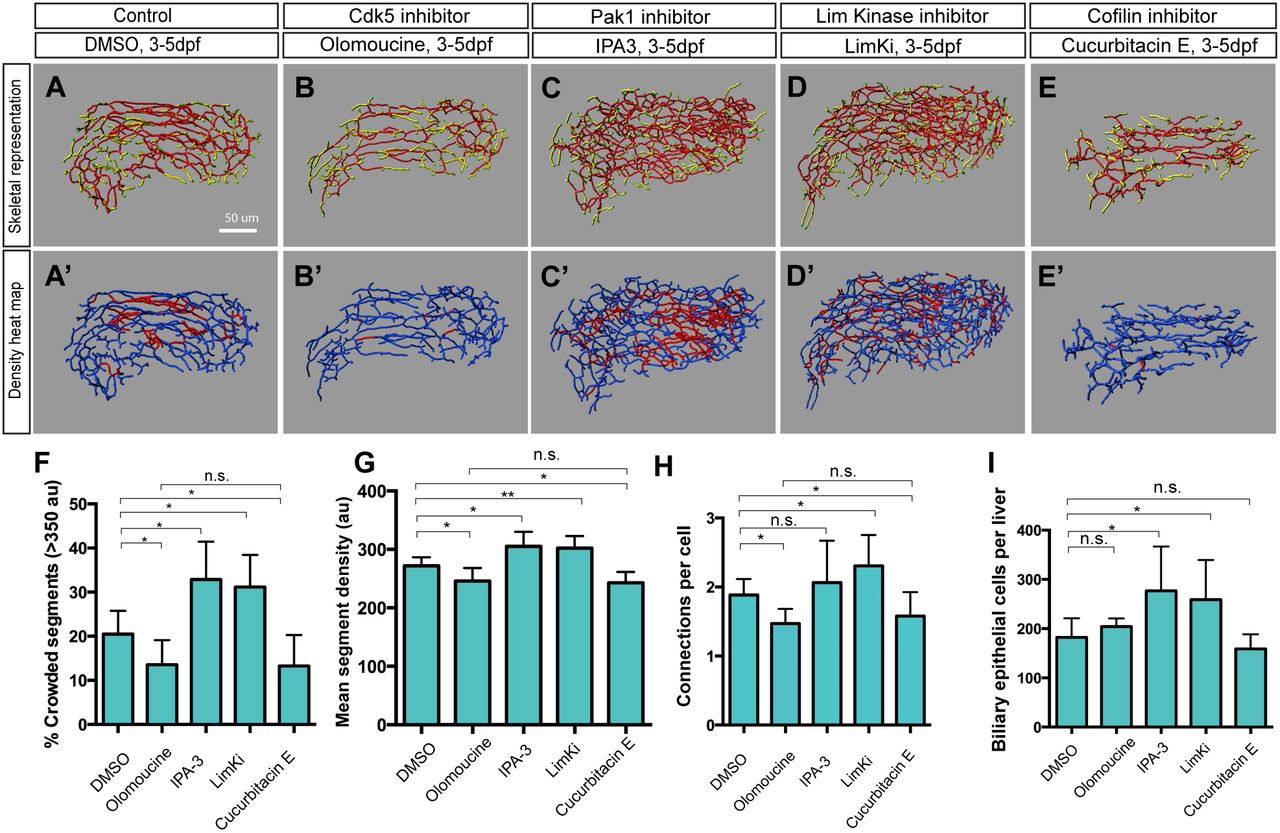
Fig. 4
The Cdk5-Pak1-LimK-Cofilin kinase cascade regulates biliary system formation. (A-E) Skeletal representations of the intrahepatic biliary network in 5 dpf wild-type Tg(Tp1-MmHbb:EGFP)um14 larvae treated from 3 to 5 dpf with DMSO (A), olomoucine (B), IPA-3 (C), LimKi (D) or cucurbitacin E (E). (A′-E′) Density heat maps of the skeletal representations, in which segments with higher density [≥350 arbitrary units (au)] and lower density (<350 au) are colored red and blue, respectively. (F-I) Measurements of intrahepatic biliary network structures by the skeletal analysis algorithm of larvae treated as in A-E. (F) Percentage of segments showing high density (>350 au), which was calculated by the density analysis algorithm, as quantified from the density heat maps shown in A′-E′. (G) Mean segment density calculated by the density analysis algorithm. (H) Number of connected branches per biliary epithelial cell in the liver at 5 dpf. (I) Mean biliary epithelial cell number per liver. Error bars are s.d. n=5 for each treatment. *P<0.05, **P<0.01; n.s., not significant.