
|
Fig. S8
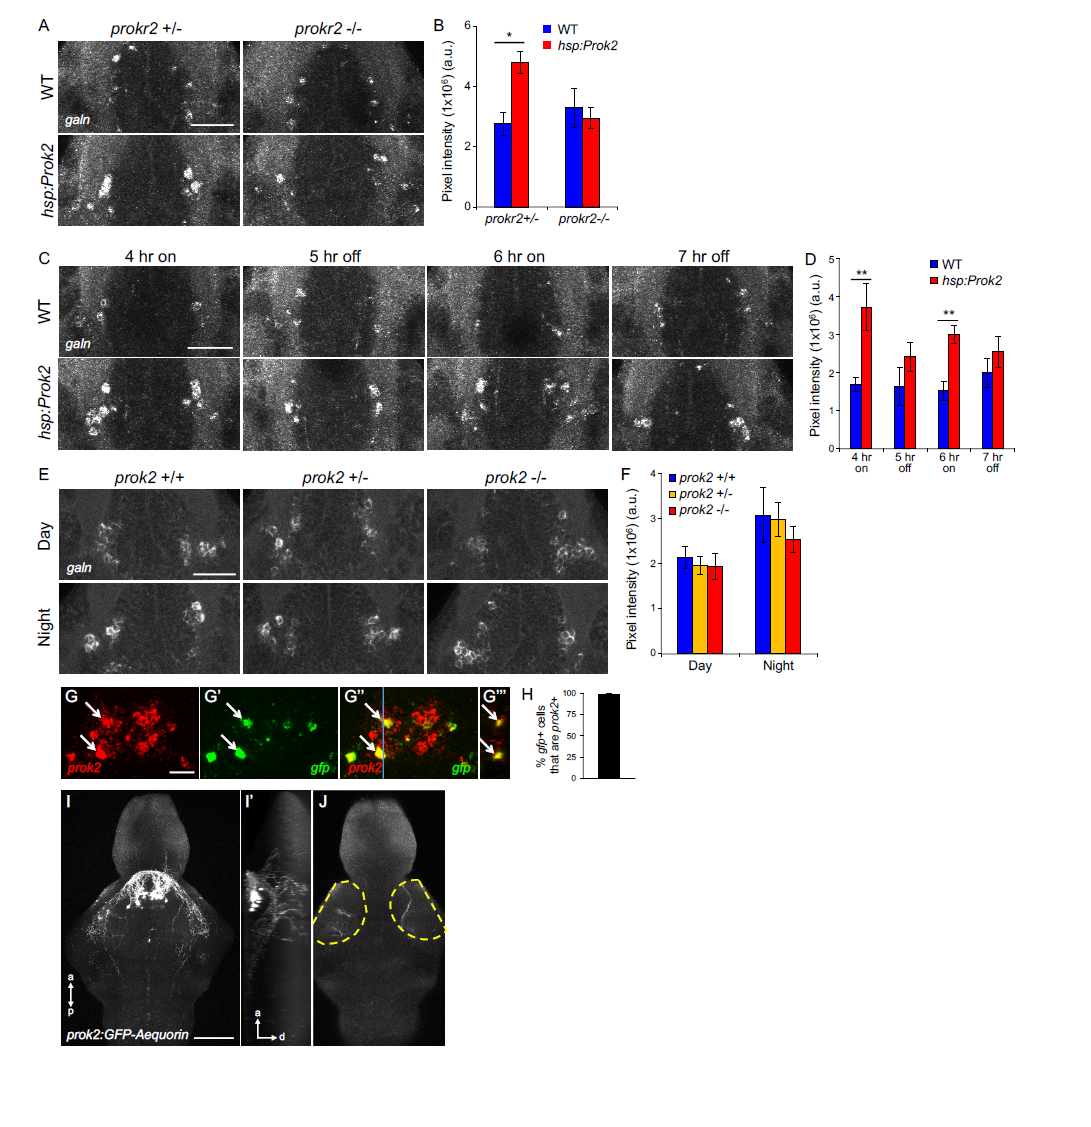
Effects of prok2 gain- and loss-of-function on hypothalamic galn expression, and prok2-expressing neuron fibers are present in the optic tectum. Related to Figure 8. (A, B) Prok2 overexpression increases hypothalamic galn expression in prokr2+/- larvae maintained in light for 4 hr after heat shock, but this effect is abolished in prokr2-/- larvae. (A) 28.8 μm thick confocal projections from representative brains showing hypothalamic galn FISH in Tg(hsp:Prok2) and non-transgenic prokr2+/- or prokr2-/- siblings. Animals were heat shocked at 6 dpf from 2-3 p.m. and then kept in light until fixation 4 hr later. (B) Mean ± SEM total fluorescence intensity of galn FISH. At least 7 brains were quantified for each condition. *p<0.05 by two-way ANOVA, with post-hock Tukey’s HSD test. (C, D) Prok2 overexpression induces galn expression in a light-specific manner. (C) 28.8 μm thick confocal projections from representative brains showing hypothalamic galn FISH. Tg(hsp:Prok2) and non-transgenic siblings were heat shocked at 6 dpf from 2-3 p.m. and then kept in light until 7 p.m. (4 hr on). Lights were then turned off for 1 hr (5 hr off), on for 1 hr (6 hr on) and off for 1 hr (7 hr off), and samples were fixed at the end of each hr. On and off refer to samples that were exposed to light or dark during the hr before fixation. (D) Mean ± SEM total fluorescence intensity of galn FISH. galn mRNA levels were only significantly higher in Prok2-overexpressing larvae that were exposed to light during the hr before fixation. At least 9 brains were analyzed for each condition. **p<0.01 by two-tailed Student’s t test. (E, F) prok2 mutant larvae have normal hypothalamic galn expression levels. (E) 28.8 μm thick confocal projections from representative brains showing hypothalamic galn expression in prok2+/+, prok2+/- and prok2-/- larvae that were raised in LD until 6 dpf and fixed at 10 a.m. (day) or 12 a.m. (night). These time points are 1 hr after lights on and off, respectively. (F) Mean ± SEM total fluorescence intensity of galn FISH. galn mRNA levels are not significantly different among the genotypes during the day or night (p>0.05 by two-way ANOVA). At least 7 brains were analyzed for each condition. (G-J) Fibers from prok2-expressing neurons are present in the optic tectum in larval zebrafish. (G) A 20 μm thick confocal projection showing the hypothalamus of a WT larva injected with a prok2:GFPAequorin transgene, fixed at 5 dpf and analyzed by double FISH using probes specific for prok2 (red) and gfp (green). (G'") shows an orthogonal view of this image at the position of the blue line in (G"), indicating co-localization of signals from the two probes. Arrows indicate examples of cells that express both genes. (H) Quantification showing that 98% of gfp-aequorin expressing cells co-express prok2, indicating that the transgene is specifically expressed in prok2-expressing neurons. Mean ± SEM for 7 animals is shown. (I) A 130 μm thick confocal projection showing the brain of a WT larva injected with the prok2:GFP-Aequorin transgene, fixed at 5 dpf and labeled with a GFP-specific antibody. The GFP-labeled neurons project extensively within the hypothalamus. (I’) shows an orthogonal view of this image, revealing dorsal projections to the optic tectum. (J) A 10 μm thick confocal section showing GFP-labeled fibers in the optic tectum. Yellow dashed lines outline the left and right optic tectum. Scale bars: (A, C, E) 50 μm, (G) 10 μm, (I) 100 μm. Anterior, posterior and dorsal axes are indicated.