
|
Fig. S2
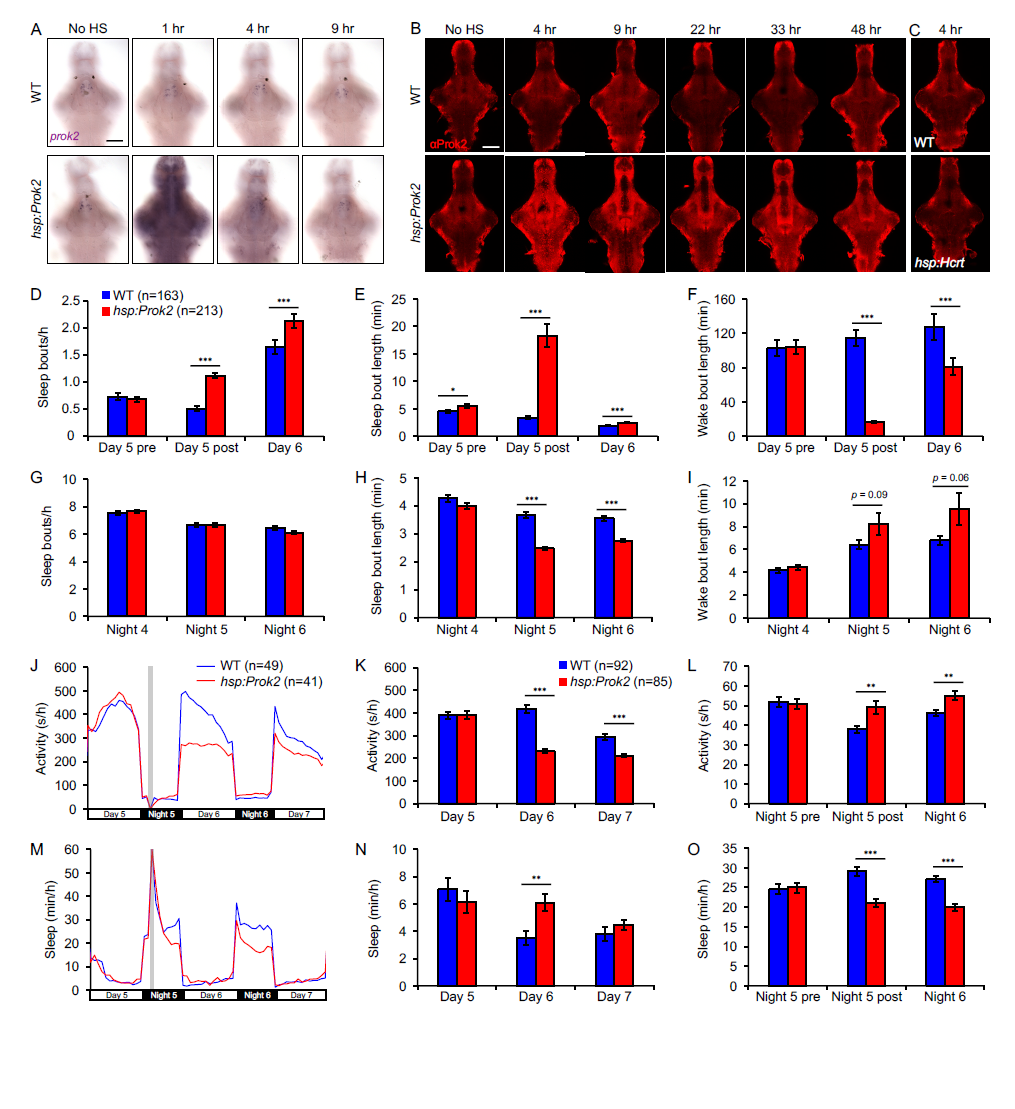
Dynamics of Prok2 overexpression, effects of induction of Prok2 overexpression during the day on sleep architecture, and induction of Prok2 overexpression at night produces a phenotype similar to that of daytime induction. Related to Figure 2. (A, B) Time course of prok2 mRNA and protein overexpression. Representative images of ISH using a prok2- specific probe (A) or IHC using a Prok2-specific antibody (B) in WT and Tg(hsp:Prok2) larvae. Larvae were heat shocked from 1-2 p.m. at 5 dpf and fixed at the indicated times after heat shock. Ectopic prok2 mRNA is detected for at least 4 hr after heat shock. Ectopic Prok2 protein can be detected for at least 48 hr after heat shock. (C) Representative images of IHC using a Prok2- specific antibody on 5 dpf WT and Tg(hsp:Hcrt) larvae fixed 4 hr after heat shock. Overexpressed Hcrt protein (Prober et al., 2006) is not detected by the Prok2-specific antibody. Brains were genotyped by PCR after imaging. No HS, no heat shock. Scale bars: 100 μm. (D-I) Following a daytime heat shock, increased daytime sleep due to Prok2 overexpression results from an increase in the number (D) and length (E) of sleep bouts, with a corresponding decrease in the length of wake bouts (F). Decreased sleep at night due to Prok2 overexpression results from a decrease in the length of sleep bouts (H). (J-O) Heat shock (gray bar in [J, M]) at night results in more activity at night (J, L) and less activity during the day (J, K) for Tg(hsp:Prok2) larvae compared to their WT siblings. Prok2 overexpression also results in less sleep at night (M, O) and more sleep during the day (M, N). These phenotypes were observed for up to 36 hr following heat shock. Note that (K, L, N, O) exclude the first two hr after heat shock to allow larvae to recover from the heat shock. Both genotypes slept more during this recovery period. Data from one representative experiment (J, M), two experiments combined (K, L, N, O) and five experiments combined (D-I) are shown. (D-I, K, L, N, O) show mean ± SEM. n = number of larvae. *p<0.05, **p<0.01, ***p<0.001 by two-tailed Student’s t test.