
Fig. 1
- ID
- ZDB-IMAGE-170807-17
- Publication
- Passoni et al., 2017 - Imaging of viral neuroinvasion in the zebrafish reveals that Sindbis and chikungunya viruses favour different entry routes
- All Figures
- Figures for Passoni et al., 2017
|
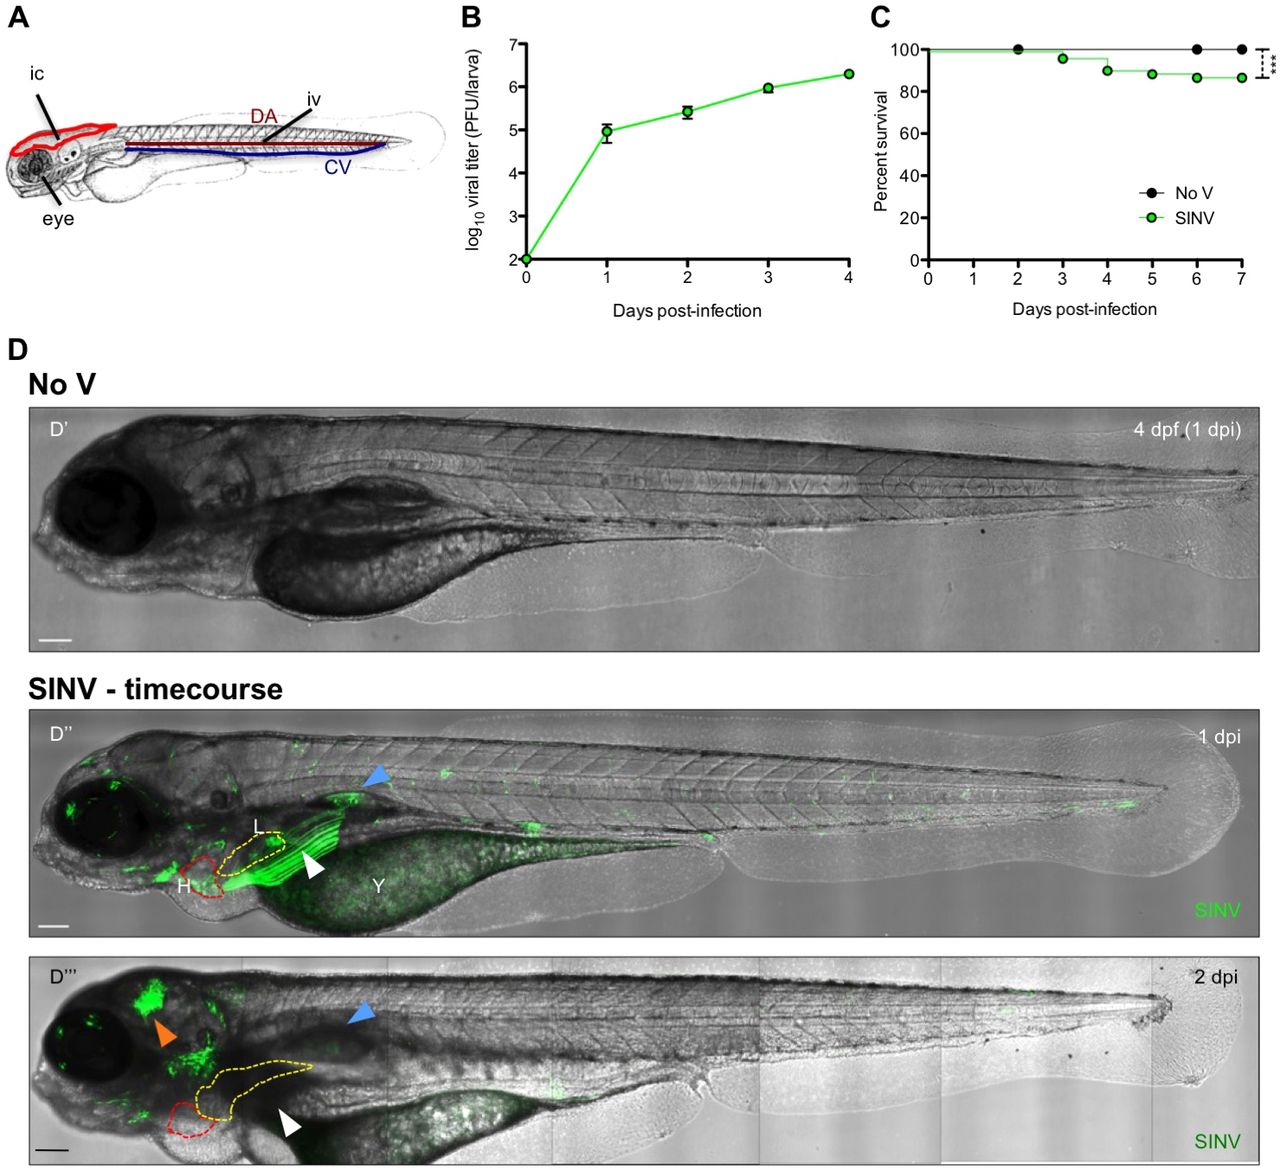
Fig. 1
SINV replicates in zebrafish larvae and exhibits a broad organ tropism. (A) Scheme of a 72 hours post-fertilization (hpf) larva, showing the sites of injection: IV, intravenously in the caudal vein (CV) or the dorsal aorta (DA); IC, intracerebrally in the optic tectum; eye, in the retina. (B) Virus replication in IV-infected zebrafish larvae, assessed by titration of homogenates of whole larvae. Data represent the means±s.e.m. of five individual larvae per time point, from three experiments pooled. (C) Survival curves of control uninfected (No V) and IV-infected zebrafish larvae (SINV). Data were pooled from five independent experiments. n=60 larvae per group. (D) Live detection of SINV-infected cells by in vivo confocal imaging, with superposition of transmitted light and GFP fluorescence (maximal projection). (D′) Uninfected control (No V), 4 dpf (1 dpi). (D″,D‴) The same IV SINV-infected (SINV) larva at 1 dpi (D″) and 2 dpi (D‴). H, heart (dotted red line); L, liver (dotted yellow line); Y, yolk (note that the yolk is autofluorescent but, as shown in D′, at a nearly undetectable level using these imaging conditions; the signal in D″ corresponds to infection); white arrowhead, infection in the left pectoral muscle; blue arrowhead, infection in the swim bladder; orange arrowhead, infection in the brain. Scale bars: 50 μm. In this and all following lateral view figures, anterior is to the left and dorsal to the top.