
|
Fig. 7
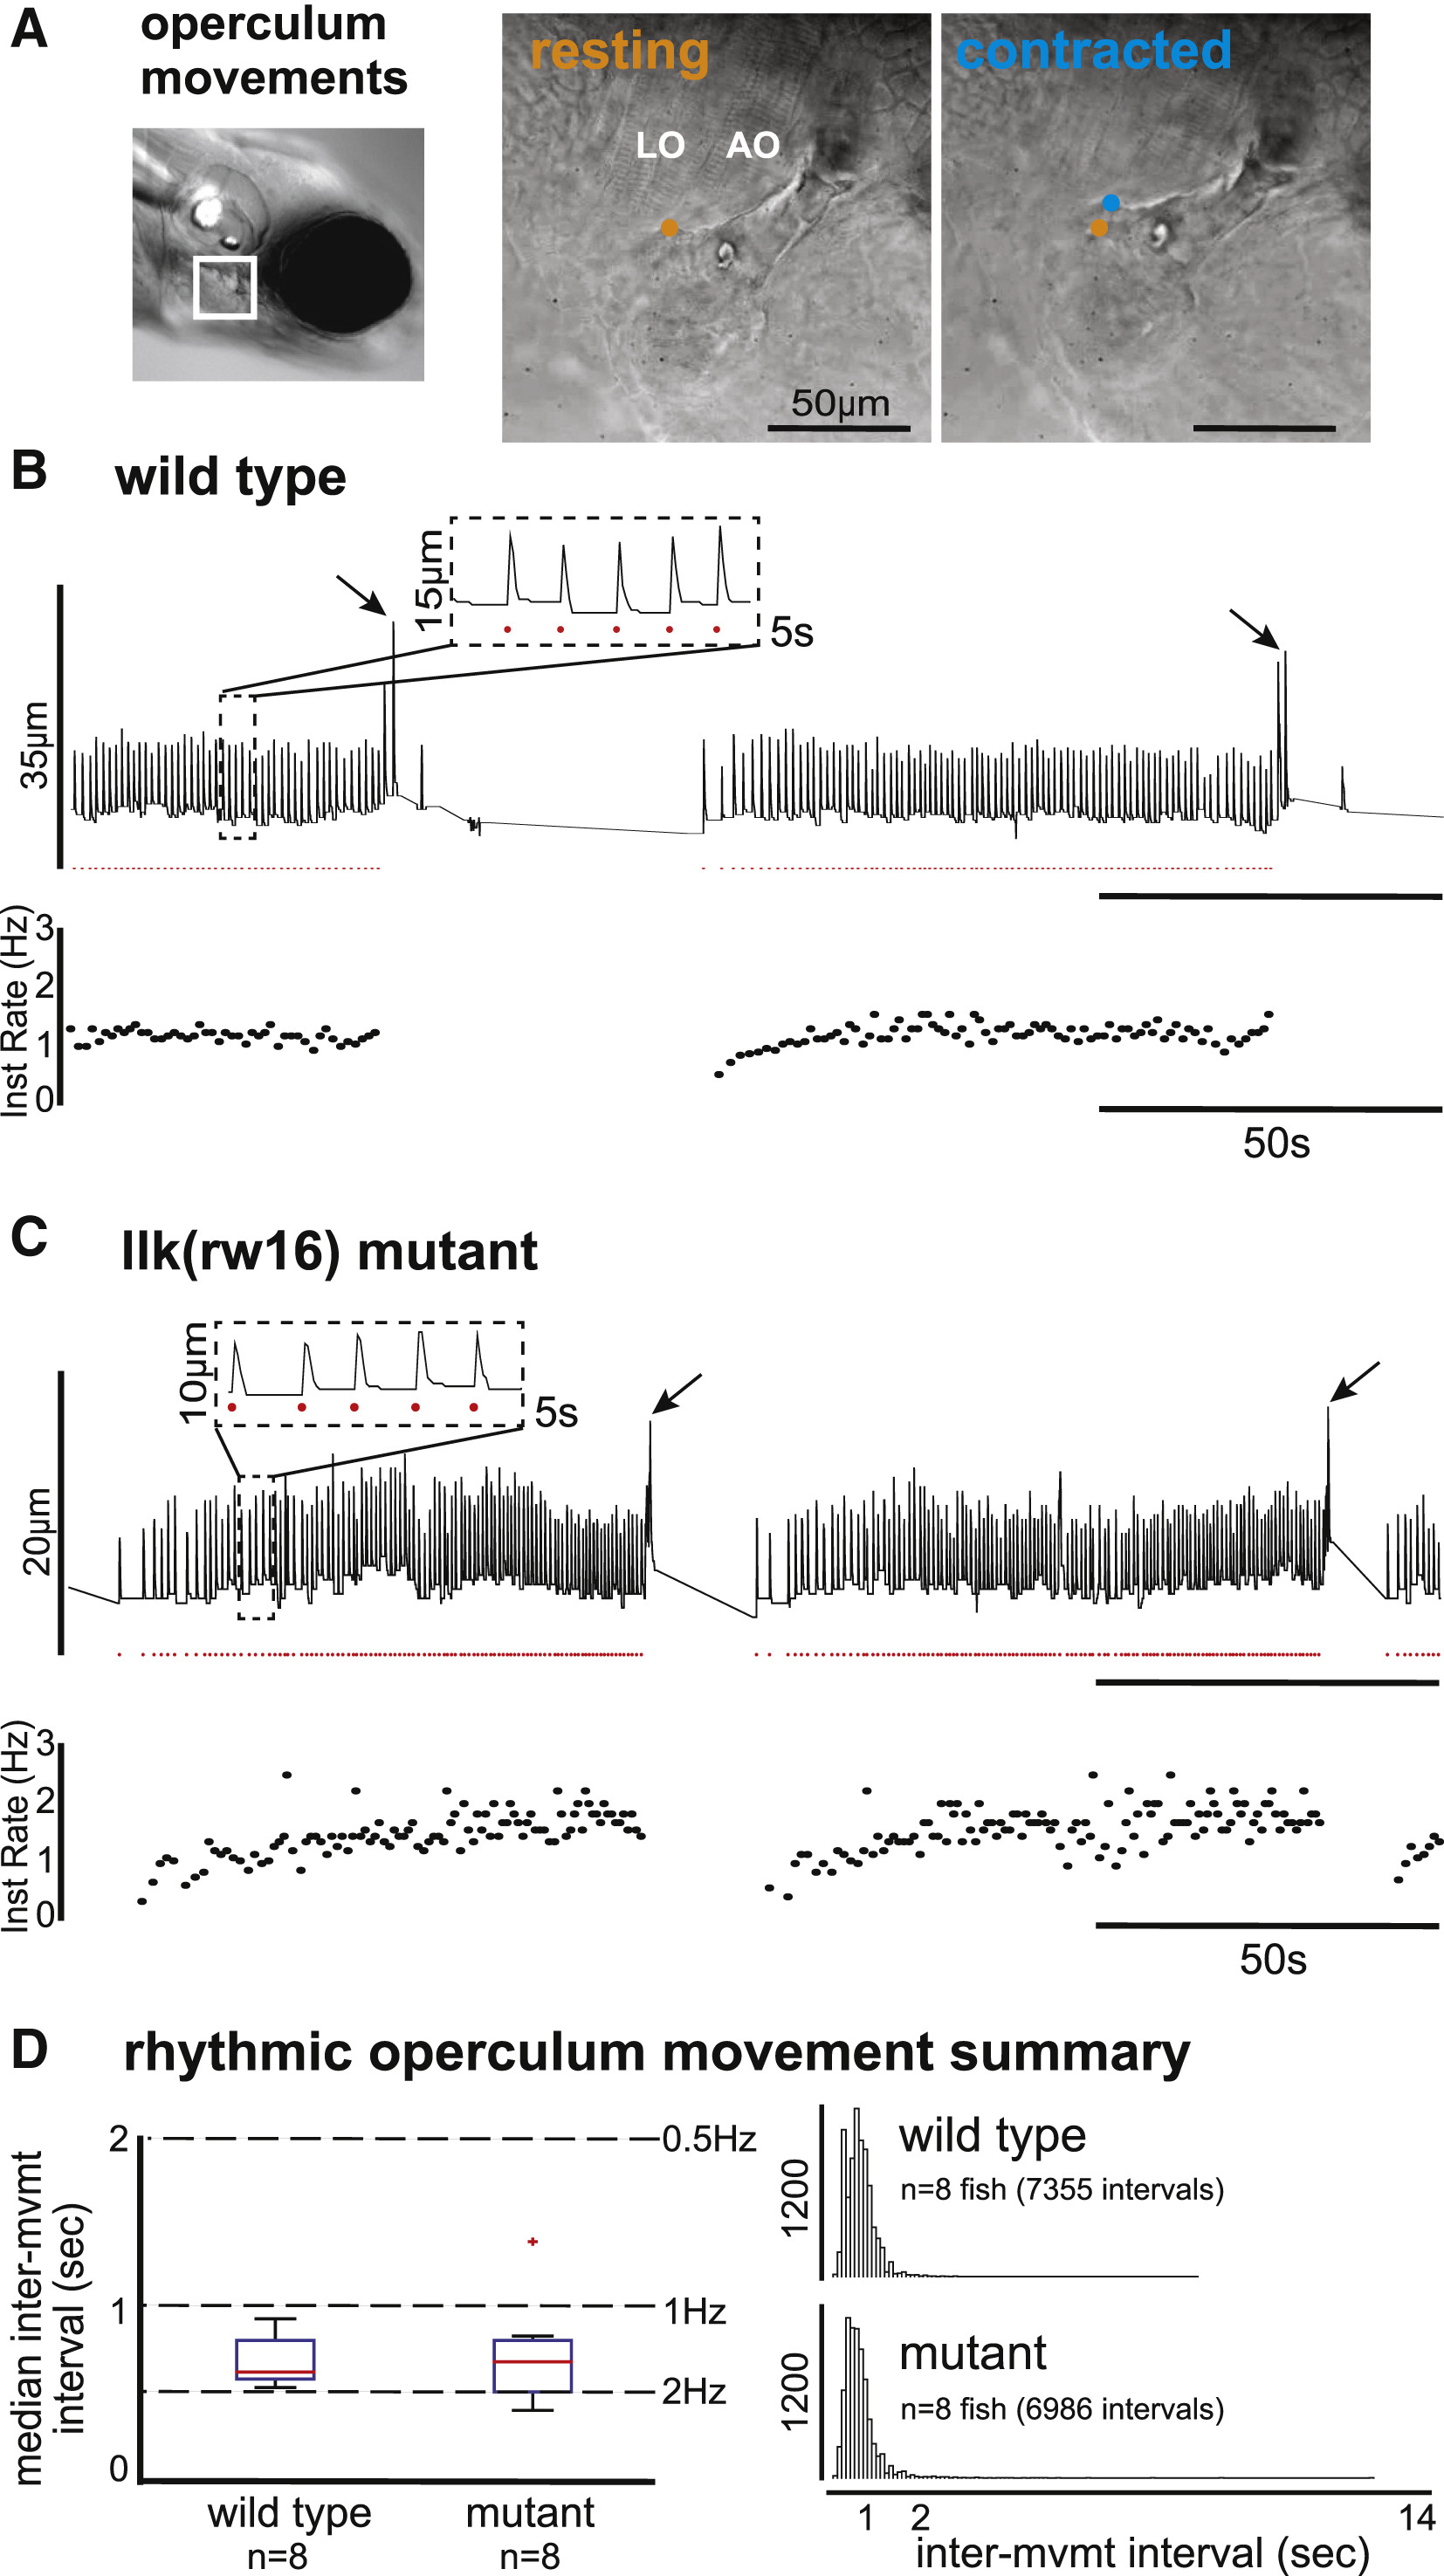
Wild-Type and Migration Mutant Larvae Exhibit Rhythmic Opercular Movements with Similar Temporal Properties
(A) Operculum rotations were manually recorded from restrained larvae by tracking the position of landmarks over time across resting (orange) and contracted (blue) states (sampling frequency = 20 Hz).
(B and C) For each example (B and C), vertical landmark position is plotted over time (top trace), with rhythmic operculum movement times indicated by red dots and instantaneous movement frequency plotted below. Both wild-type (B) and llk(rw16) mutant (C) larvae exhibit bouts of rhythmic operculum rotation.
(D) The box-whisker plot (left) shows the distribution of per-fish median inter-movement intervals in wild-type (n = 8) and mutant (n = 8) larvae. The histograms (right) show the complete distribution of inter-movement intervals in wild-type (top; n = 7,355 intervals) and mutant (bottom; n = 6,986 intervals) larvae. Migration phenotype was not a significant predictor of inter-movement interval (p = 0.613; see Table S3).