
|
Fig. 5
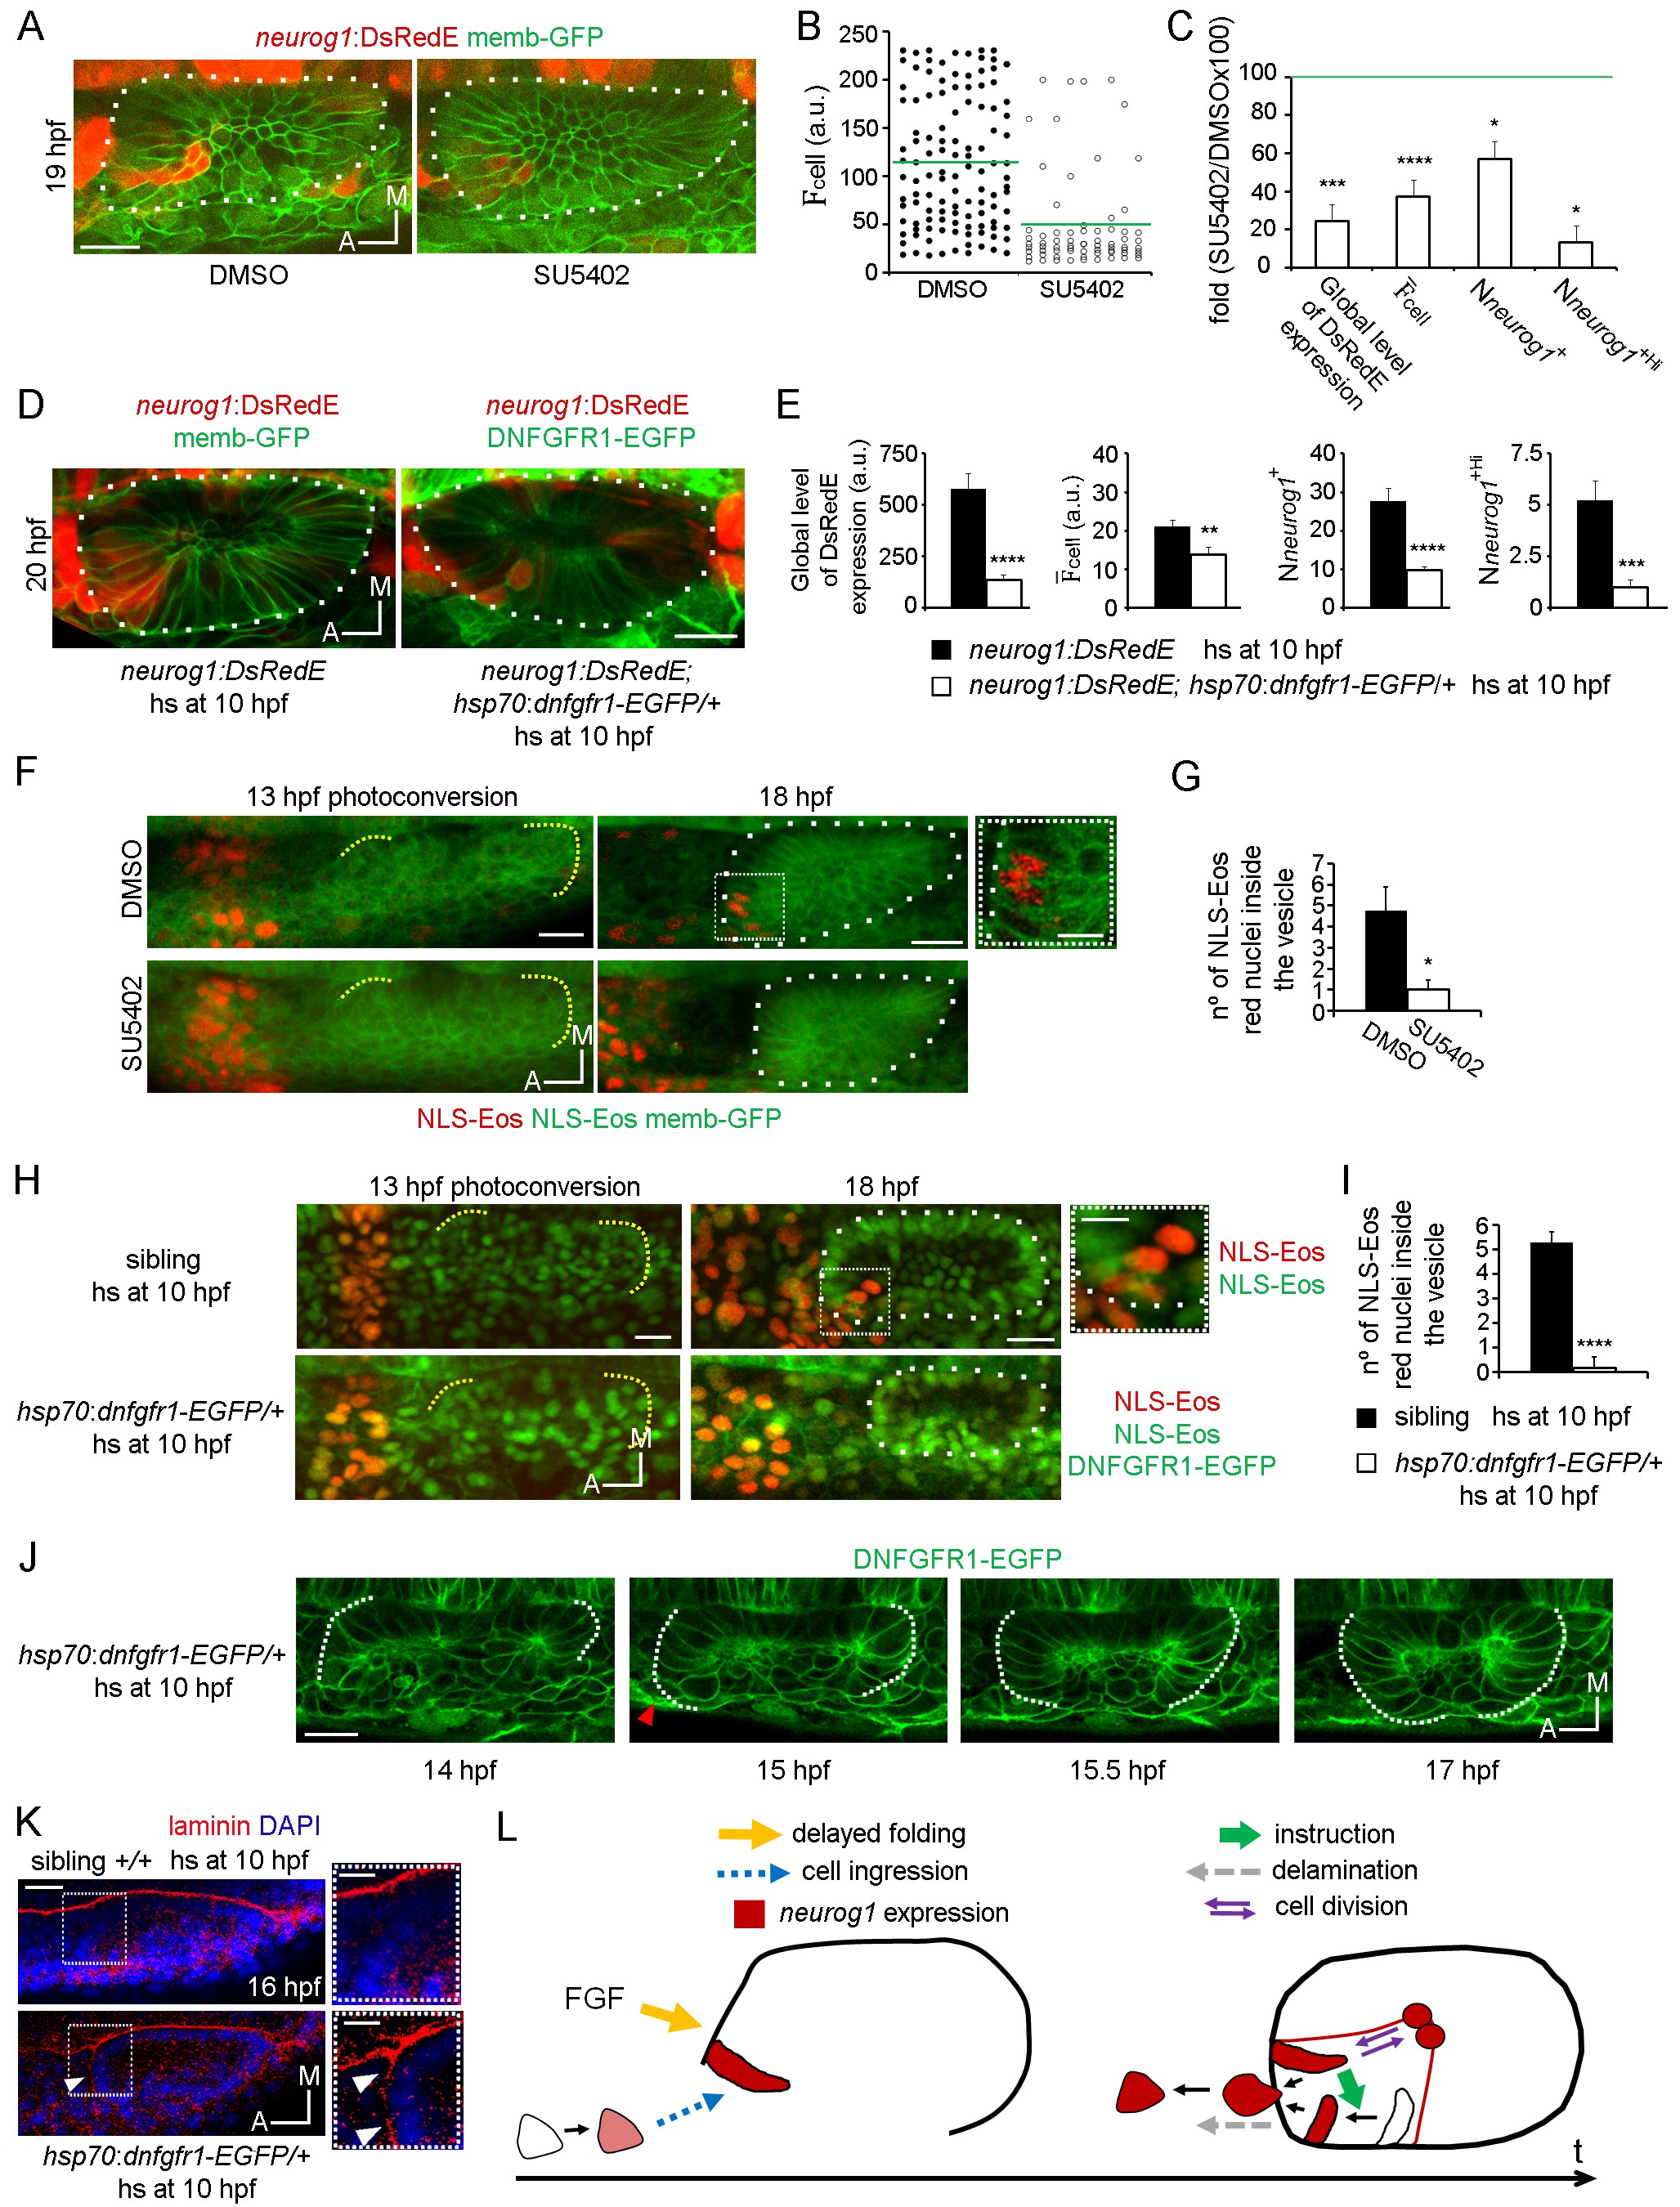
FGF control of neuronal specification.
(A–C) neurog1 expression pattern inside the vesicle in embryos incubated in DMSO or SU5402. (A) Images of otic vesicles at 19 hpf incubated from 11 hpf in DMSO or SU5402 (ventral planes). (B) Quantification of cell for cells of vesicles from the groups shown in (A). Each dot indicates one cell. Green lines indicate the mean of each condition. n = 5 for DMSO and n = 6 for SU5402. (C) Parameters of neuronal specification at the single cell level for the data shown in (B): global level of DsRed expression, cell, Nneurog1+ and Nneurog1+Hi are shown as fold change of SU5402/DMSOx100. (D,E) neurog1 expression pattern inside the vesicle from neurog1:DsRedE;hsp70:dnfgfr1-EGFP/+ or neurog1:DsRedE embryos heat-shocked at 10 hpf. (D) Z-projections of otic vesicles at 20 hpf. (E) Parameters of neuronal specification are shown: global level of DsRed expression, cell, Nneurog1+ and Nneurog1+Hi (n = 8). (F) Photoconversion at 13 hpf of NLS-Eos stained nuclei in a region anterior to the otic epithelium. Embryos expressed memb-GFP and were treated with DMSO or SU5402 from 11 hpf (z-projections). At 18 hpf, photoconverted nuclei is observed inside the vesicle of the DMSO treated embryo. High magnification in the right (dotted square, Scale bar 10 µm). Yellow dotted lines indicate the limits of the otic epithelium. (G) Quantification of the number of photoconverted nuclei inside the vesicle (n = 6 for DMSO and n = 7 for SU5402). (H,I) Photoconversion experiments as in (F,G) but on hsp70:dnfgfr1-EGFP/+ and sibling embryos heat-shocked at 10 hpf. (H) Z-projections of the photoconversion and cell ingression. (I) Quantification of the number of photoconverted nuclei inside the vesicle (n = 7 for siblings and n = 6 for hsp70:dnfgfr1-EGFP/+). (J) Selected images from a time-lapse of hsp70:dnfgfr1-EGFP/+ embryos heat-shocked at 10 hpf. Note that as early as 14 hpf the anterior part of the otic tissue is already folding, at 15 hpf the process is advanced (red arrowhead), and at 15.5 hpf the anterior and posterior regions seem to be symmetrically folded (see also Video 13). (K) Laminin immunostainings at 16 hpf in hsp70:dnfgfr1-EGFP/+ and sibling embryos heat-shocked at 10 hpf. The nuclei were counterstained with DAPI. High magnification in the right (dotted square, Scale bar 10 µm). The images are representative of 6 embryos analysed. Note the formation of a continuous layer of laminin in some regions (white arrowheads). (L) Scheme of cell dynamics playing a role in neuronal patterning of the inner ear. FGF signalling delays anterior tissue folding allowing the ingression of pioneer neurog1+ cells in the prospective neurogenic domain of the otic epithelium. These pioneer cells promote neurog1 expression in other cells of the neurogenic domain. In addition, neurog1+ cells divide symmetrically and delaminate. Data are mean ± s.e.m. t-test ****p<0.001, ***p<0.005, **p<0.01, *p<0.05. Scale b