
|
Fig. 4 S2
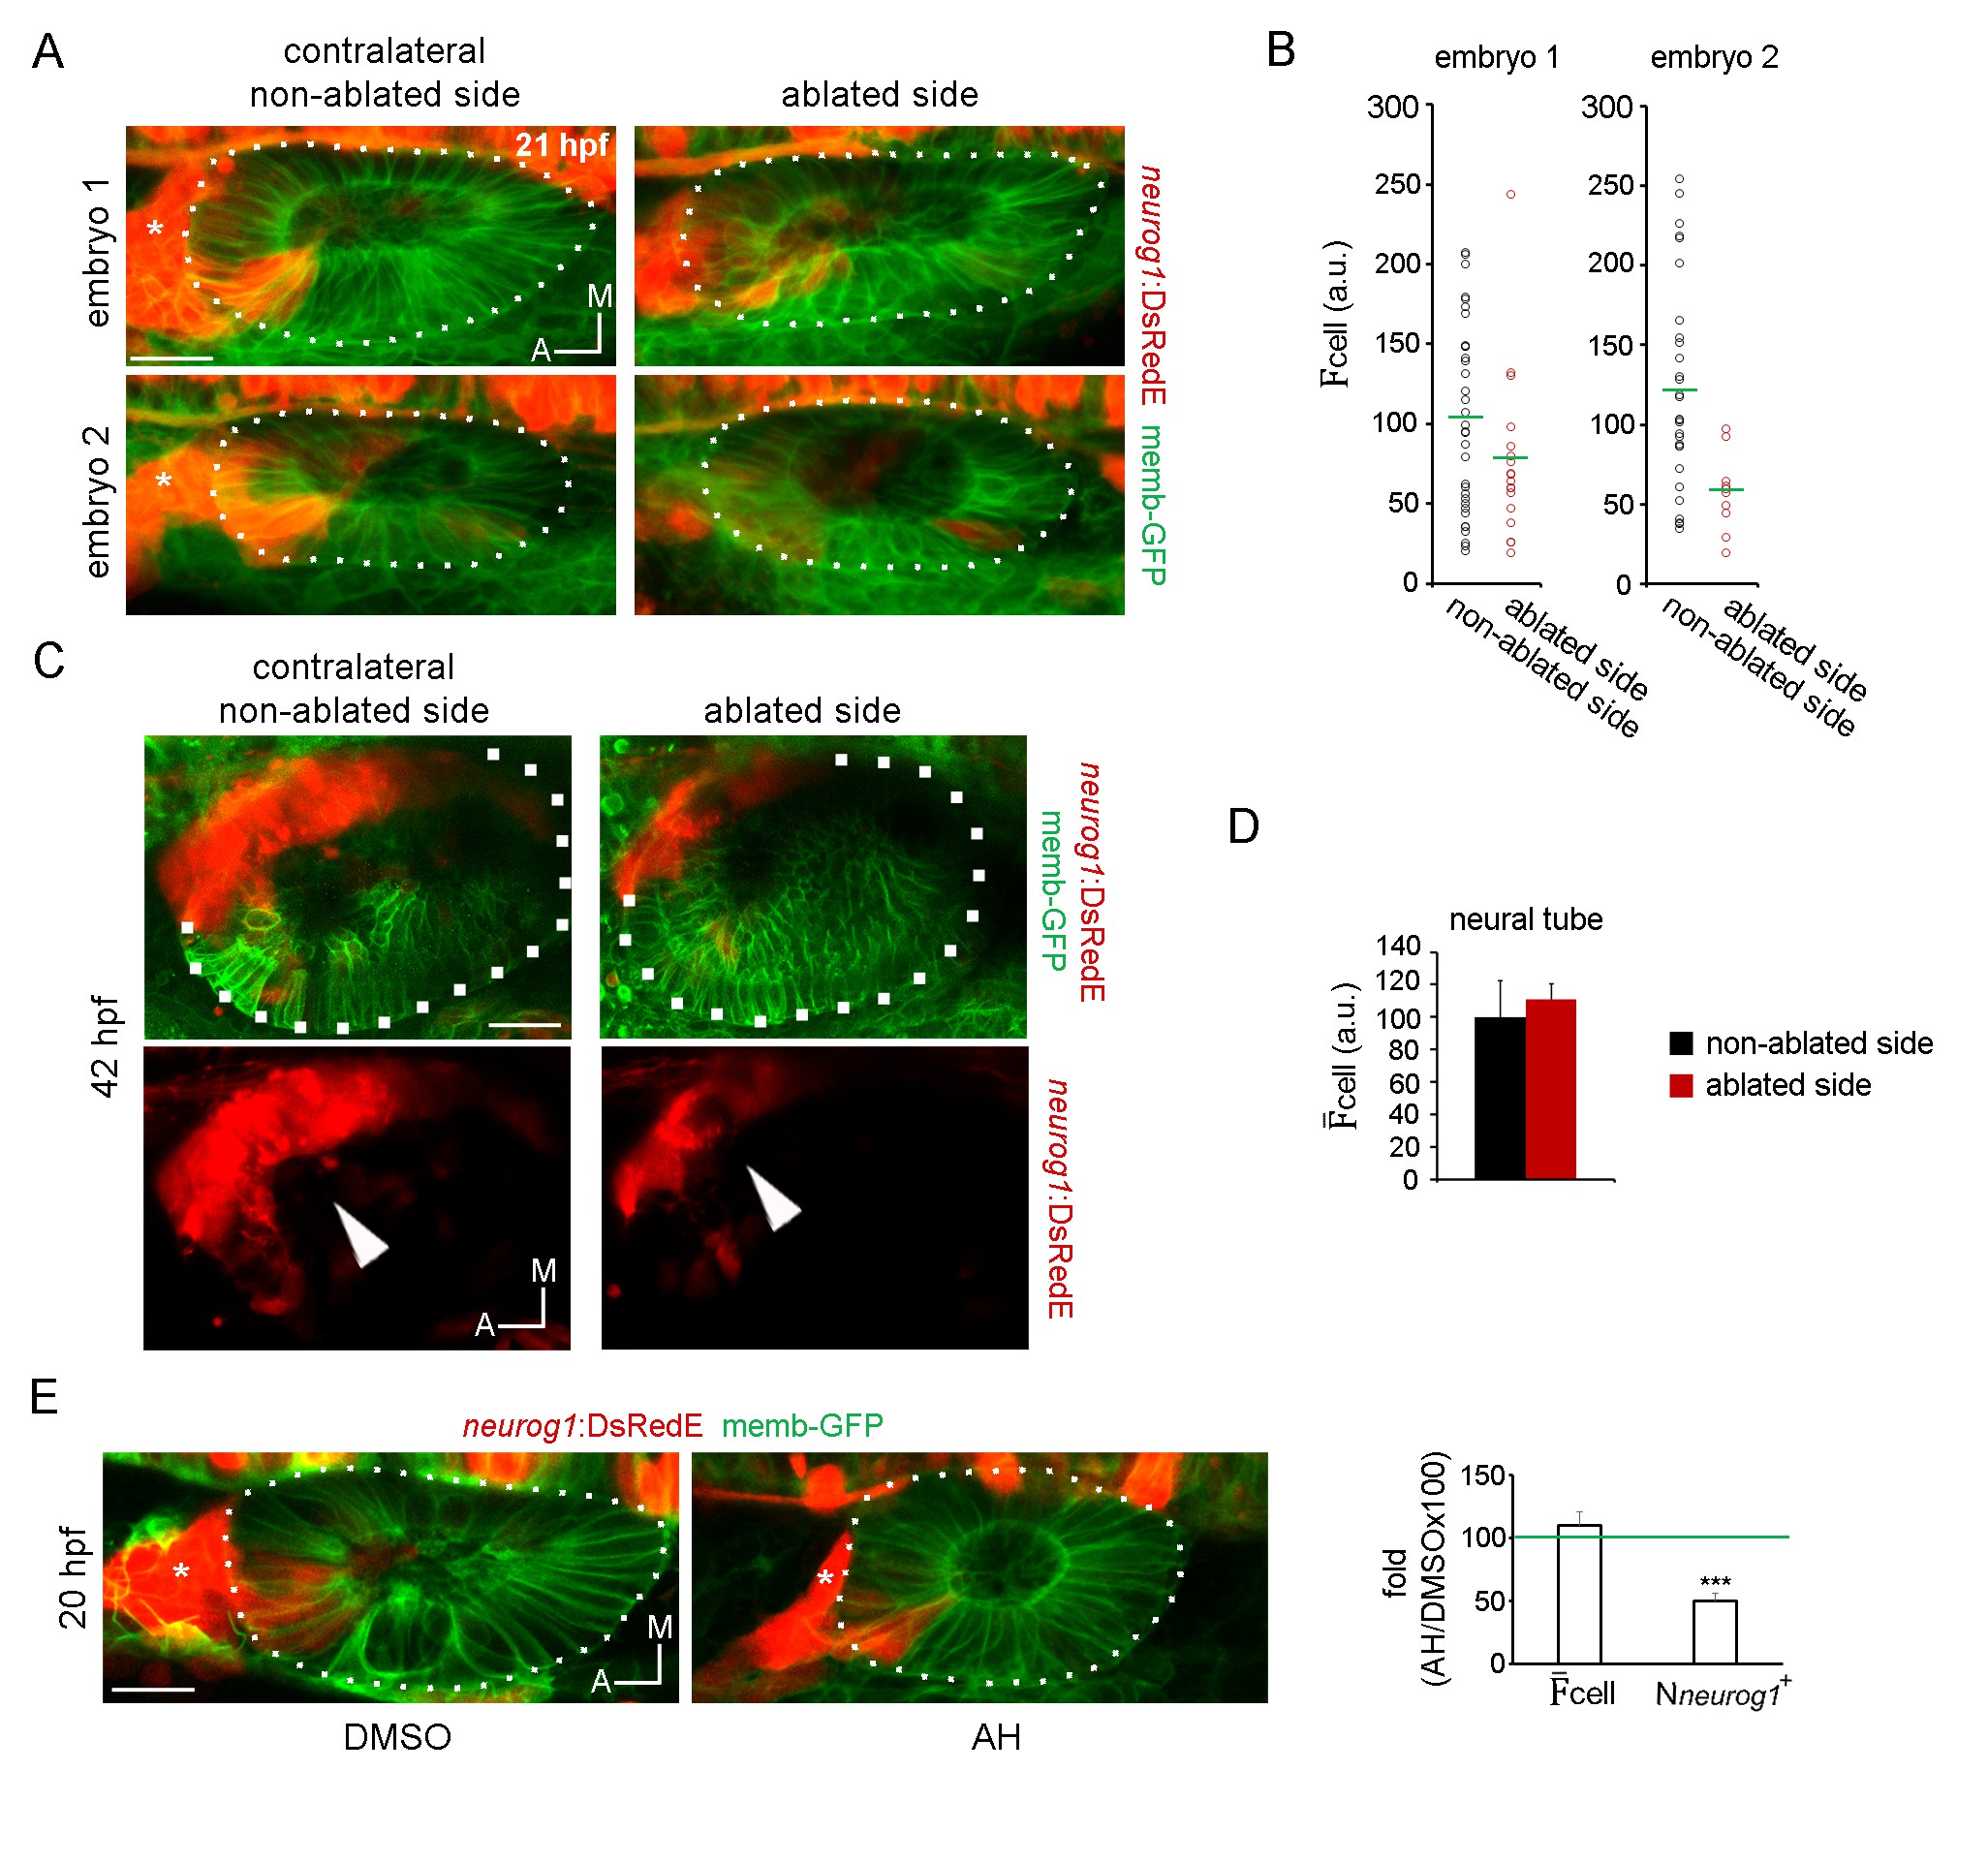
Late neurogenic phenotypes after ablation and specification analysis of non-proliferative otic placodes.
(A) Z-projection images of the embryos shown in Figure 4, A and B, 8 hr after ablation (21 hpf). The ablated side and their contralateral non-ablated side of the same embryo are shown (images are representative of the phenotypes observed in 4 embryos at this stage, see also Video 12). Asterisk indicates the SAG. (B) Quantification of the mean DsRedE fluorescence in each neurog1+ cell of the vesicles shown in (A). Each dot indicates one cell. Green lines indicate the mean of each condition. (C) Z-projection images of otic vesicles and the SAG at 42 hpf from an neurog1-DsRedE embryo ablated at 13 hpf (the ablated side and their contralateral non-ablated side of the same embryo are shown). Note the reduction in size of the SAG in the ablated size of the embryos. Images are representative of 3 embryos analysed. (D) Quantification of the cell in a region of the neural tube adjacent to the otic vesicle 5 hr after ablation (18 hpf). Data are mean ± s.e.m. (70 cells were counted in each region, n = 3). (E) Z-projection images of neurog1 expression pattern inside the vesicle at 20 hpf in DMSO and AH treated embryos. On the right, quantifications of the cell and the Nneurog1+ are shown as the fold change of the AH group respect to the DMSO group (n = 14 for DMSO and n = 12 for AH). Data are mean ± s.e.m. t-test, ***p<0.0001. Scale bars, 20 µm. Asterisk indicates the SAG. Dotted lines outline the limits of the otic vesicle.