
|
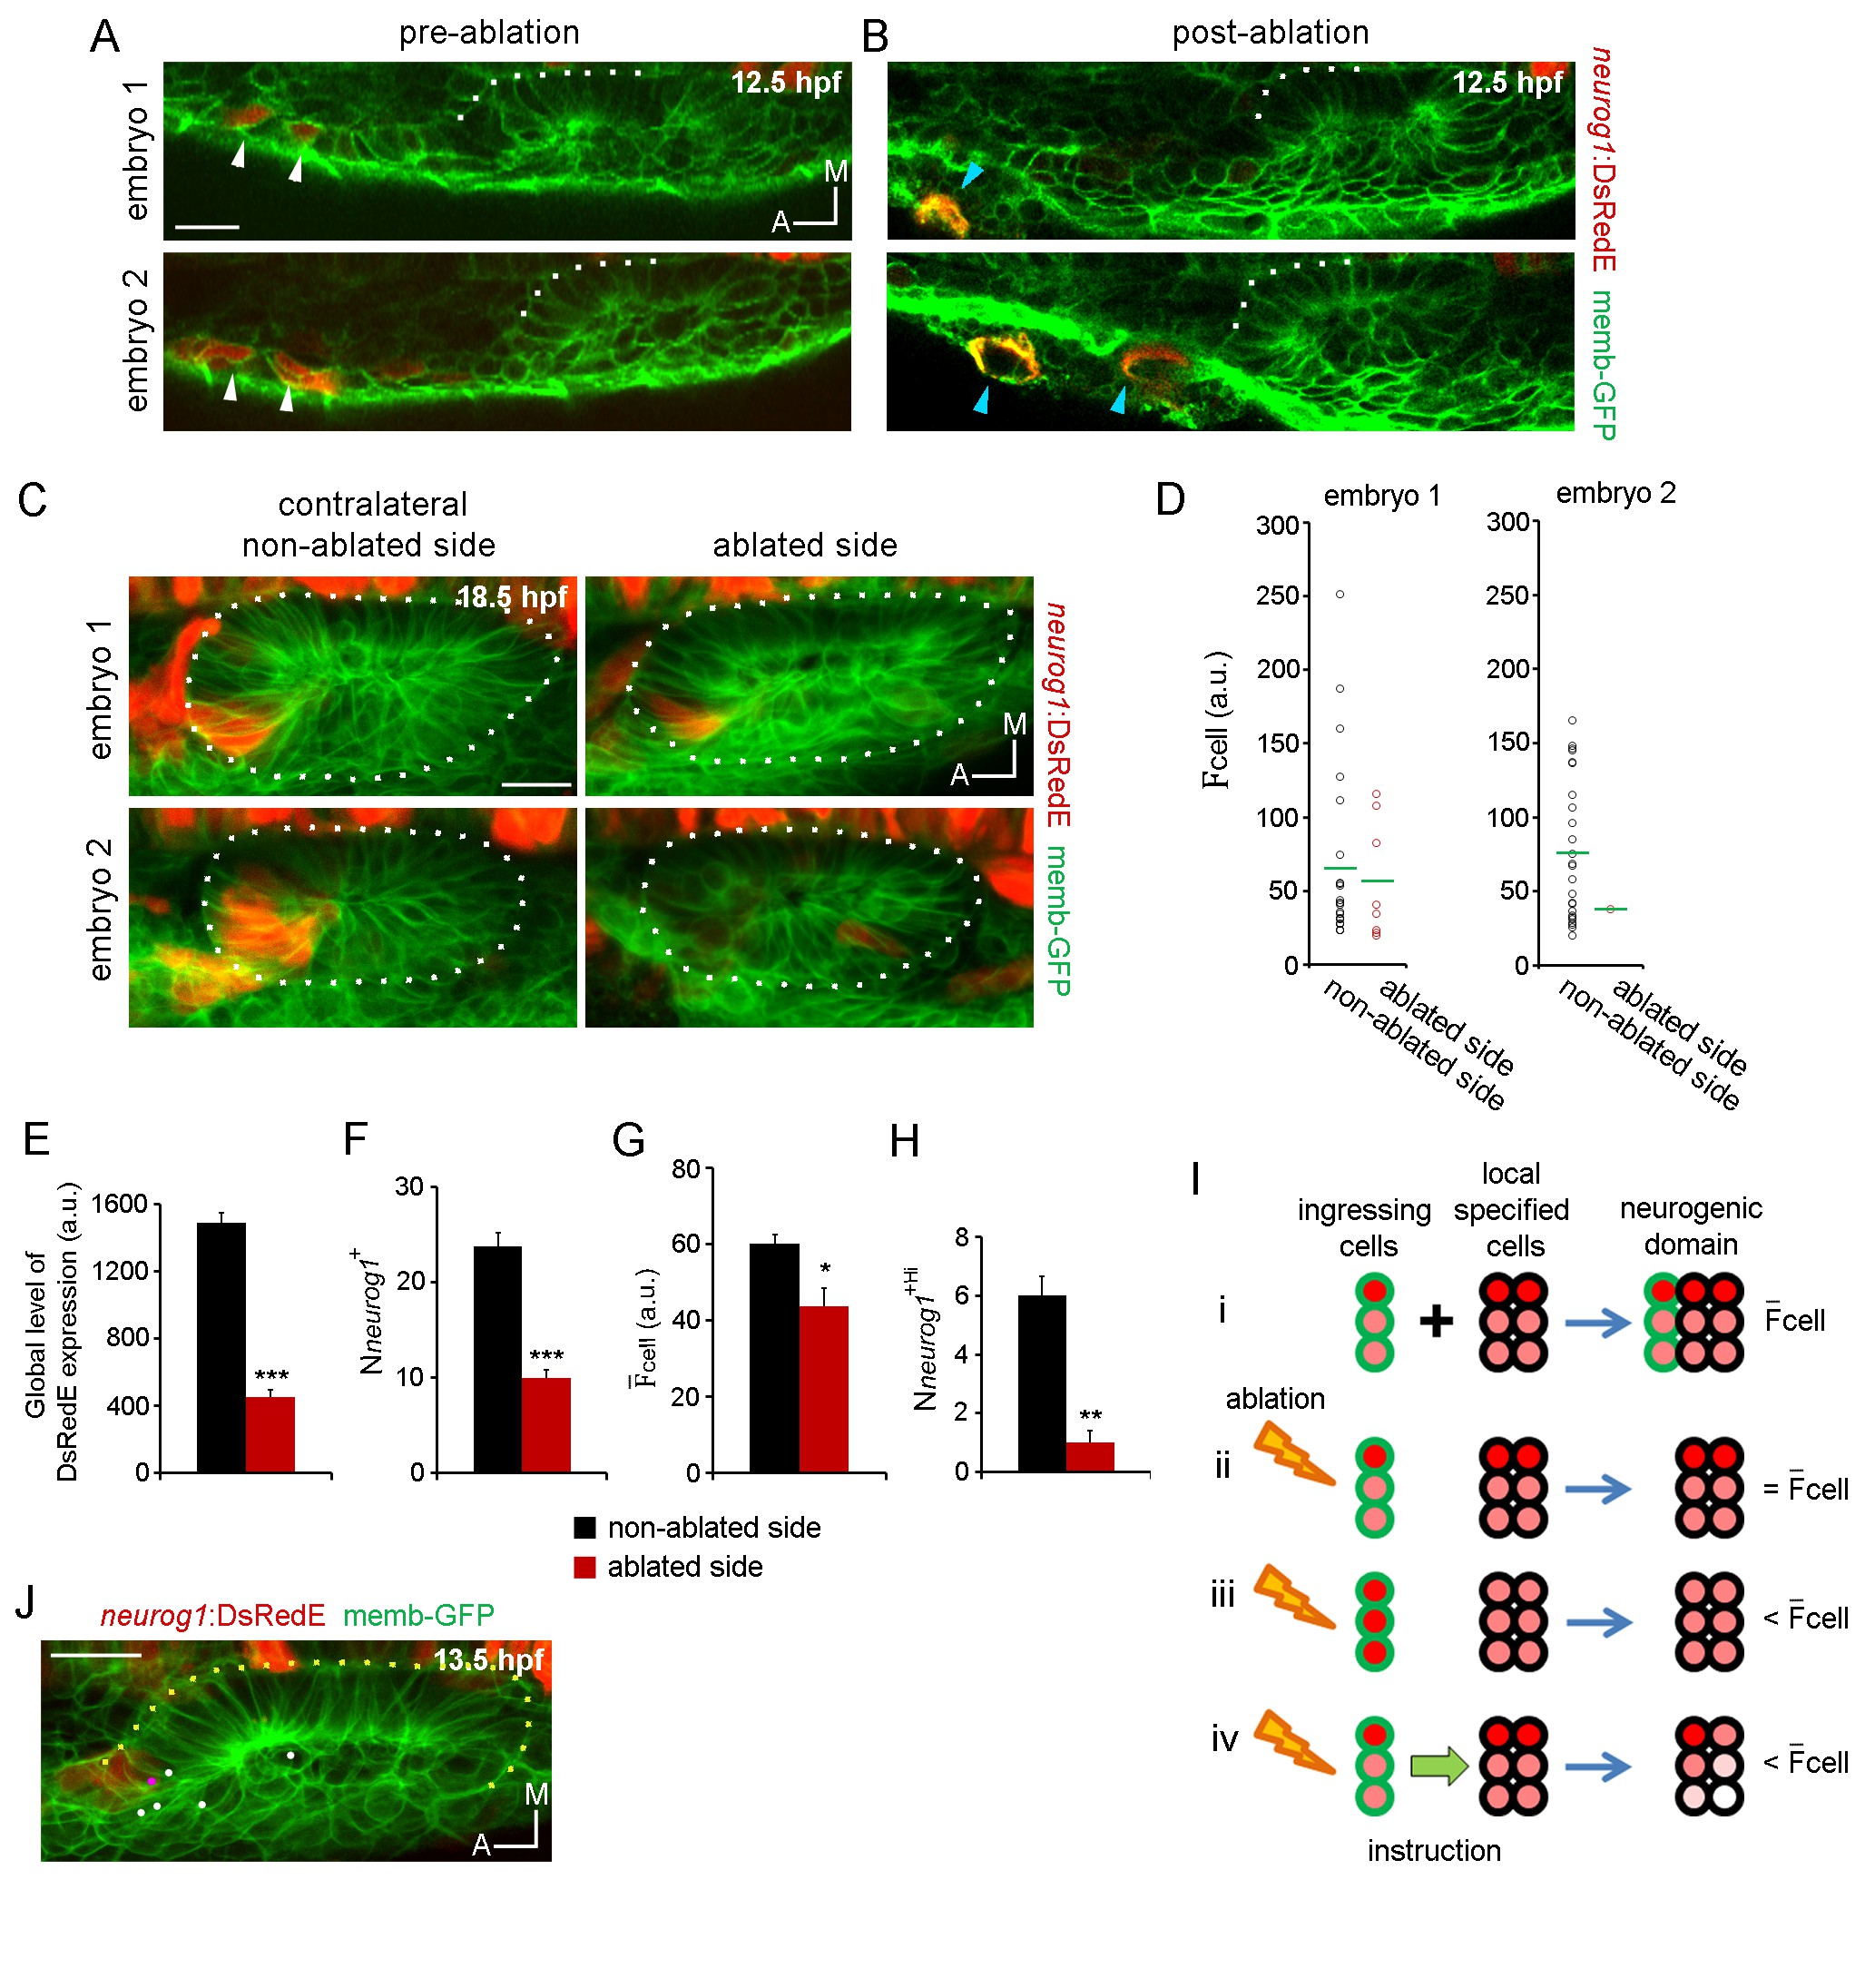
Fig. 4
Ingressing cells instruct local neuronal specification.
(A,B) Laser ablation of neurog1+ cells before ingression. Two different embryos are shown. Images of the otic epithelium and its anterior region at 12.5 hpf just before (A) and after (B) laser-ablation. White arrowheads indicate neurog1+ cells. Blue arrowheads localise the ablated region. Embryo 1 only received one laser pulse and embryo 2 three laser pulses (only two are visible in this plane). The contrast of the red signal was increased to improve visualisation. (C–H) neurog1 expression pattern inside the vesicle after ablation. (C) Average z-projections of embryos shown in (A,B) 5 hr after ablation (18.5 hpf). The ablated side and their contralateral non-ablated side of the same embryo are shown. (D) Quantification of cell in each neurog1+ cell of the vesicles shown in (C). Each dot indicates one cell. Green lines indicate the mean of each condition. The number of neurog1+ cells in each vesicle is: embryo 1, non-ablated side: 24, ablated side: 8; embryo 2, non-ablated side: 25, ablated side: 2. (E–H) Parameters of neuronal specification at the single cell level are shown: global level of DsRed expression (E) Nneurog1+ (F), cell (G), and Nneurog1+Hi (H). Data are mean ± s.e.m. (n = 6). t-test ***p<0.0001, **p<0.0005, *p<0.05. (I) Scheme with of different explanations of how early ablation of ingressing cells influences cell inside the vesicle at later stages. (i) In absence of cell ablation the neurogenic domain is composed by ingressing and local specified cells, with a characteristic value for