
Image
|
Figure Caption
Fig. 3 S1
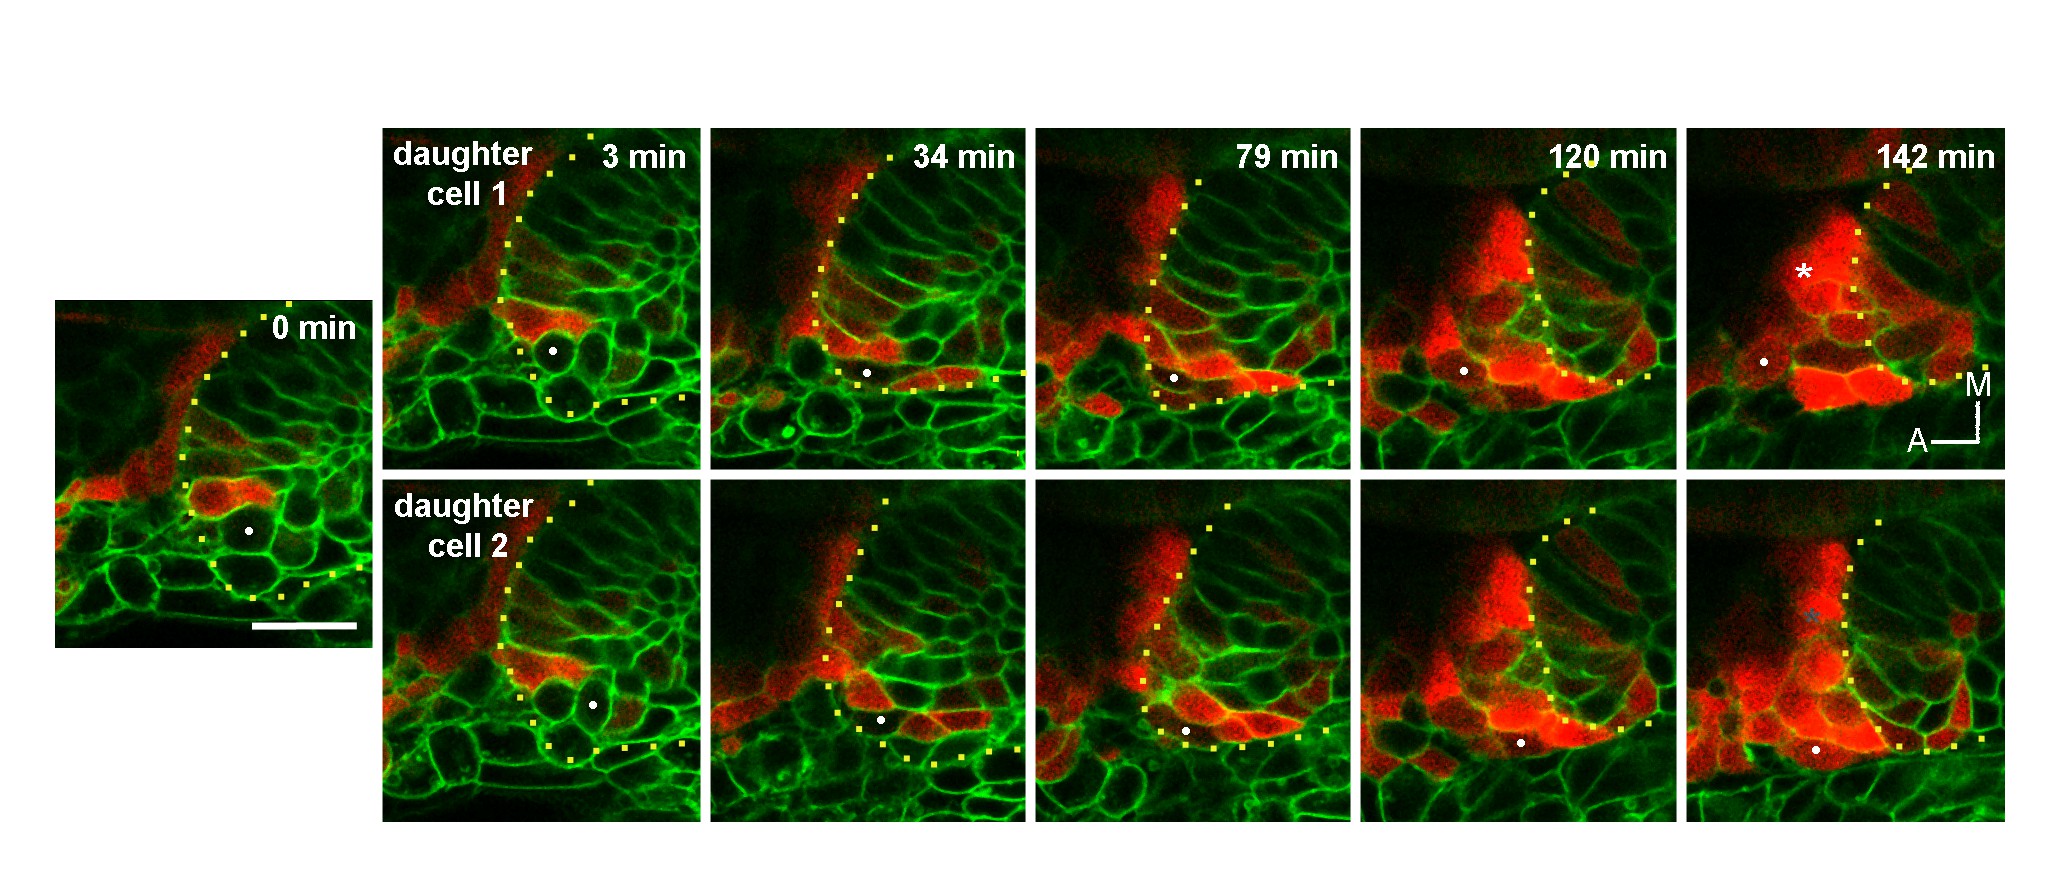
Cell division can precede neurog1 expression.
3D tracking of a neurog1− cell (white dot) that divides and subsequently their daughters express DsRedE and delaminate. Dotted lines outline the limits of the otic vesicle. Asterisk indicates the SAG.
Acknowledgments
This image is the copyrighted work of the attributed author or publisher, and
ZFIN has permission only to display this image to its users.
Additional permissions should be obtained from the applicable author or publisher of the image.
Full text @ Elife