
|
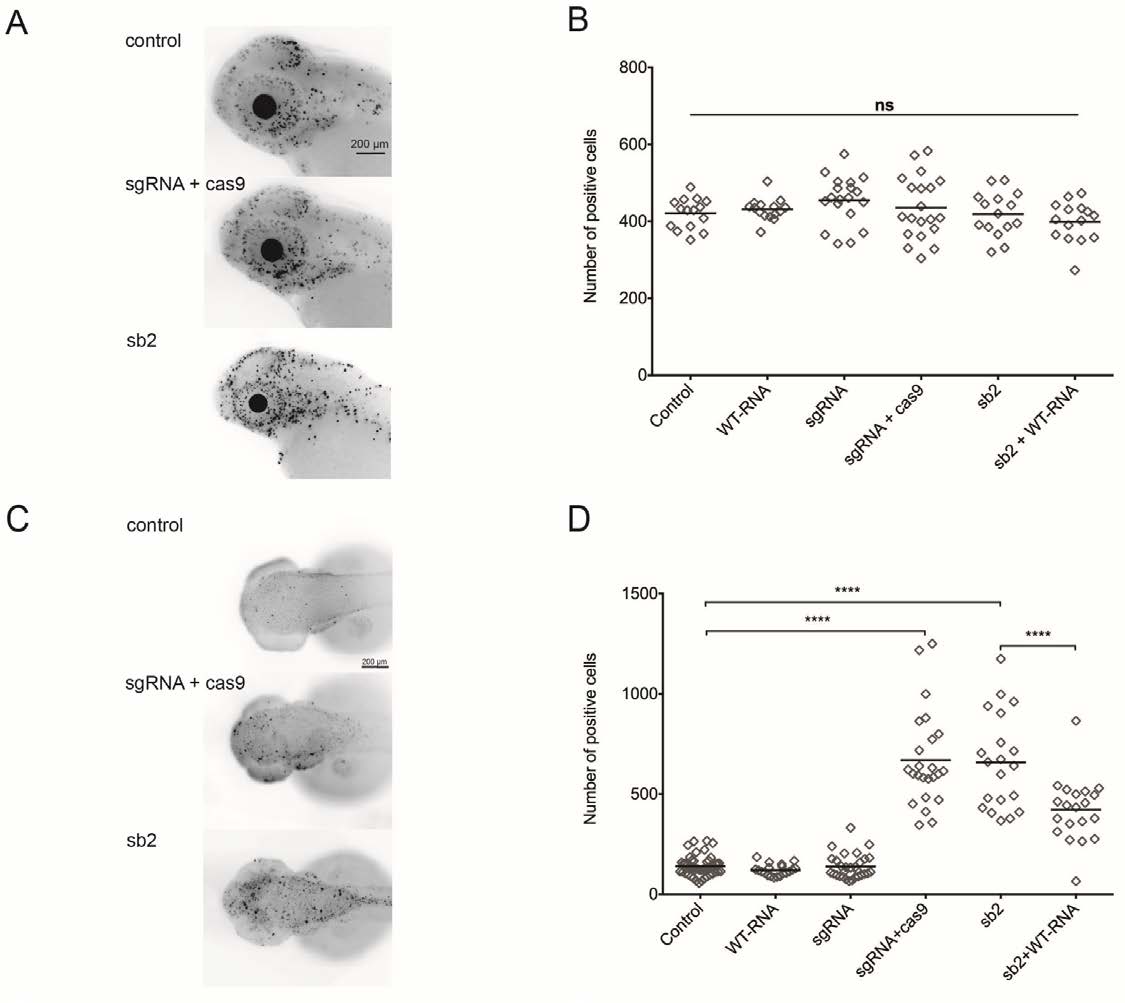
Fig. S4.2
Apoptosis and cell cycle markers (M-phase) quantified in cep55l morphants and F0 mutants. (A) Larvae were fixed at 2 days post fertilization and stained with rabbit IgG polyclonal p-Histone H3 (Ser 10)-R antibody to highlight the presence of dividing cells in the anterior structures of the zebrafish central nervous system. Representative lateral views of inverted fluorescent images are shown. (B) Plot represents the quantification of fluorescent signals marked by the pH3 (Ser 10)-R antibody for each injected condition. All injected conditions listed display no significant differences from one another. n=15-20 embryos/injection. (C) Larvae were fixed at 2 dpf and stained with the ApopTag rhodamine in situ Apoptosis Detection kit (Chemicon) to detect apoptotic cells. Representative dorsal views are shown (D) Plot representing the number of ApopTag rhodamine positive cells per injected condition. sgRNA + Cas9 injected embryos display an increase of apoptotic markers compared to both uninjected and sgRNA-alone conditions. n=20-58 embryos/condition, repeated. **** indicates p<0.0001; ns, not significant.