
|
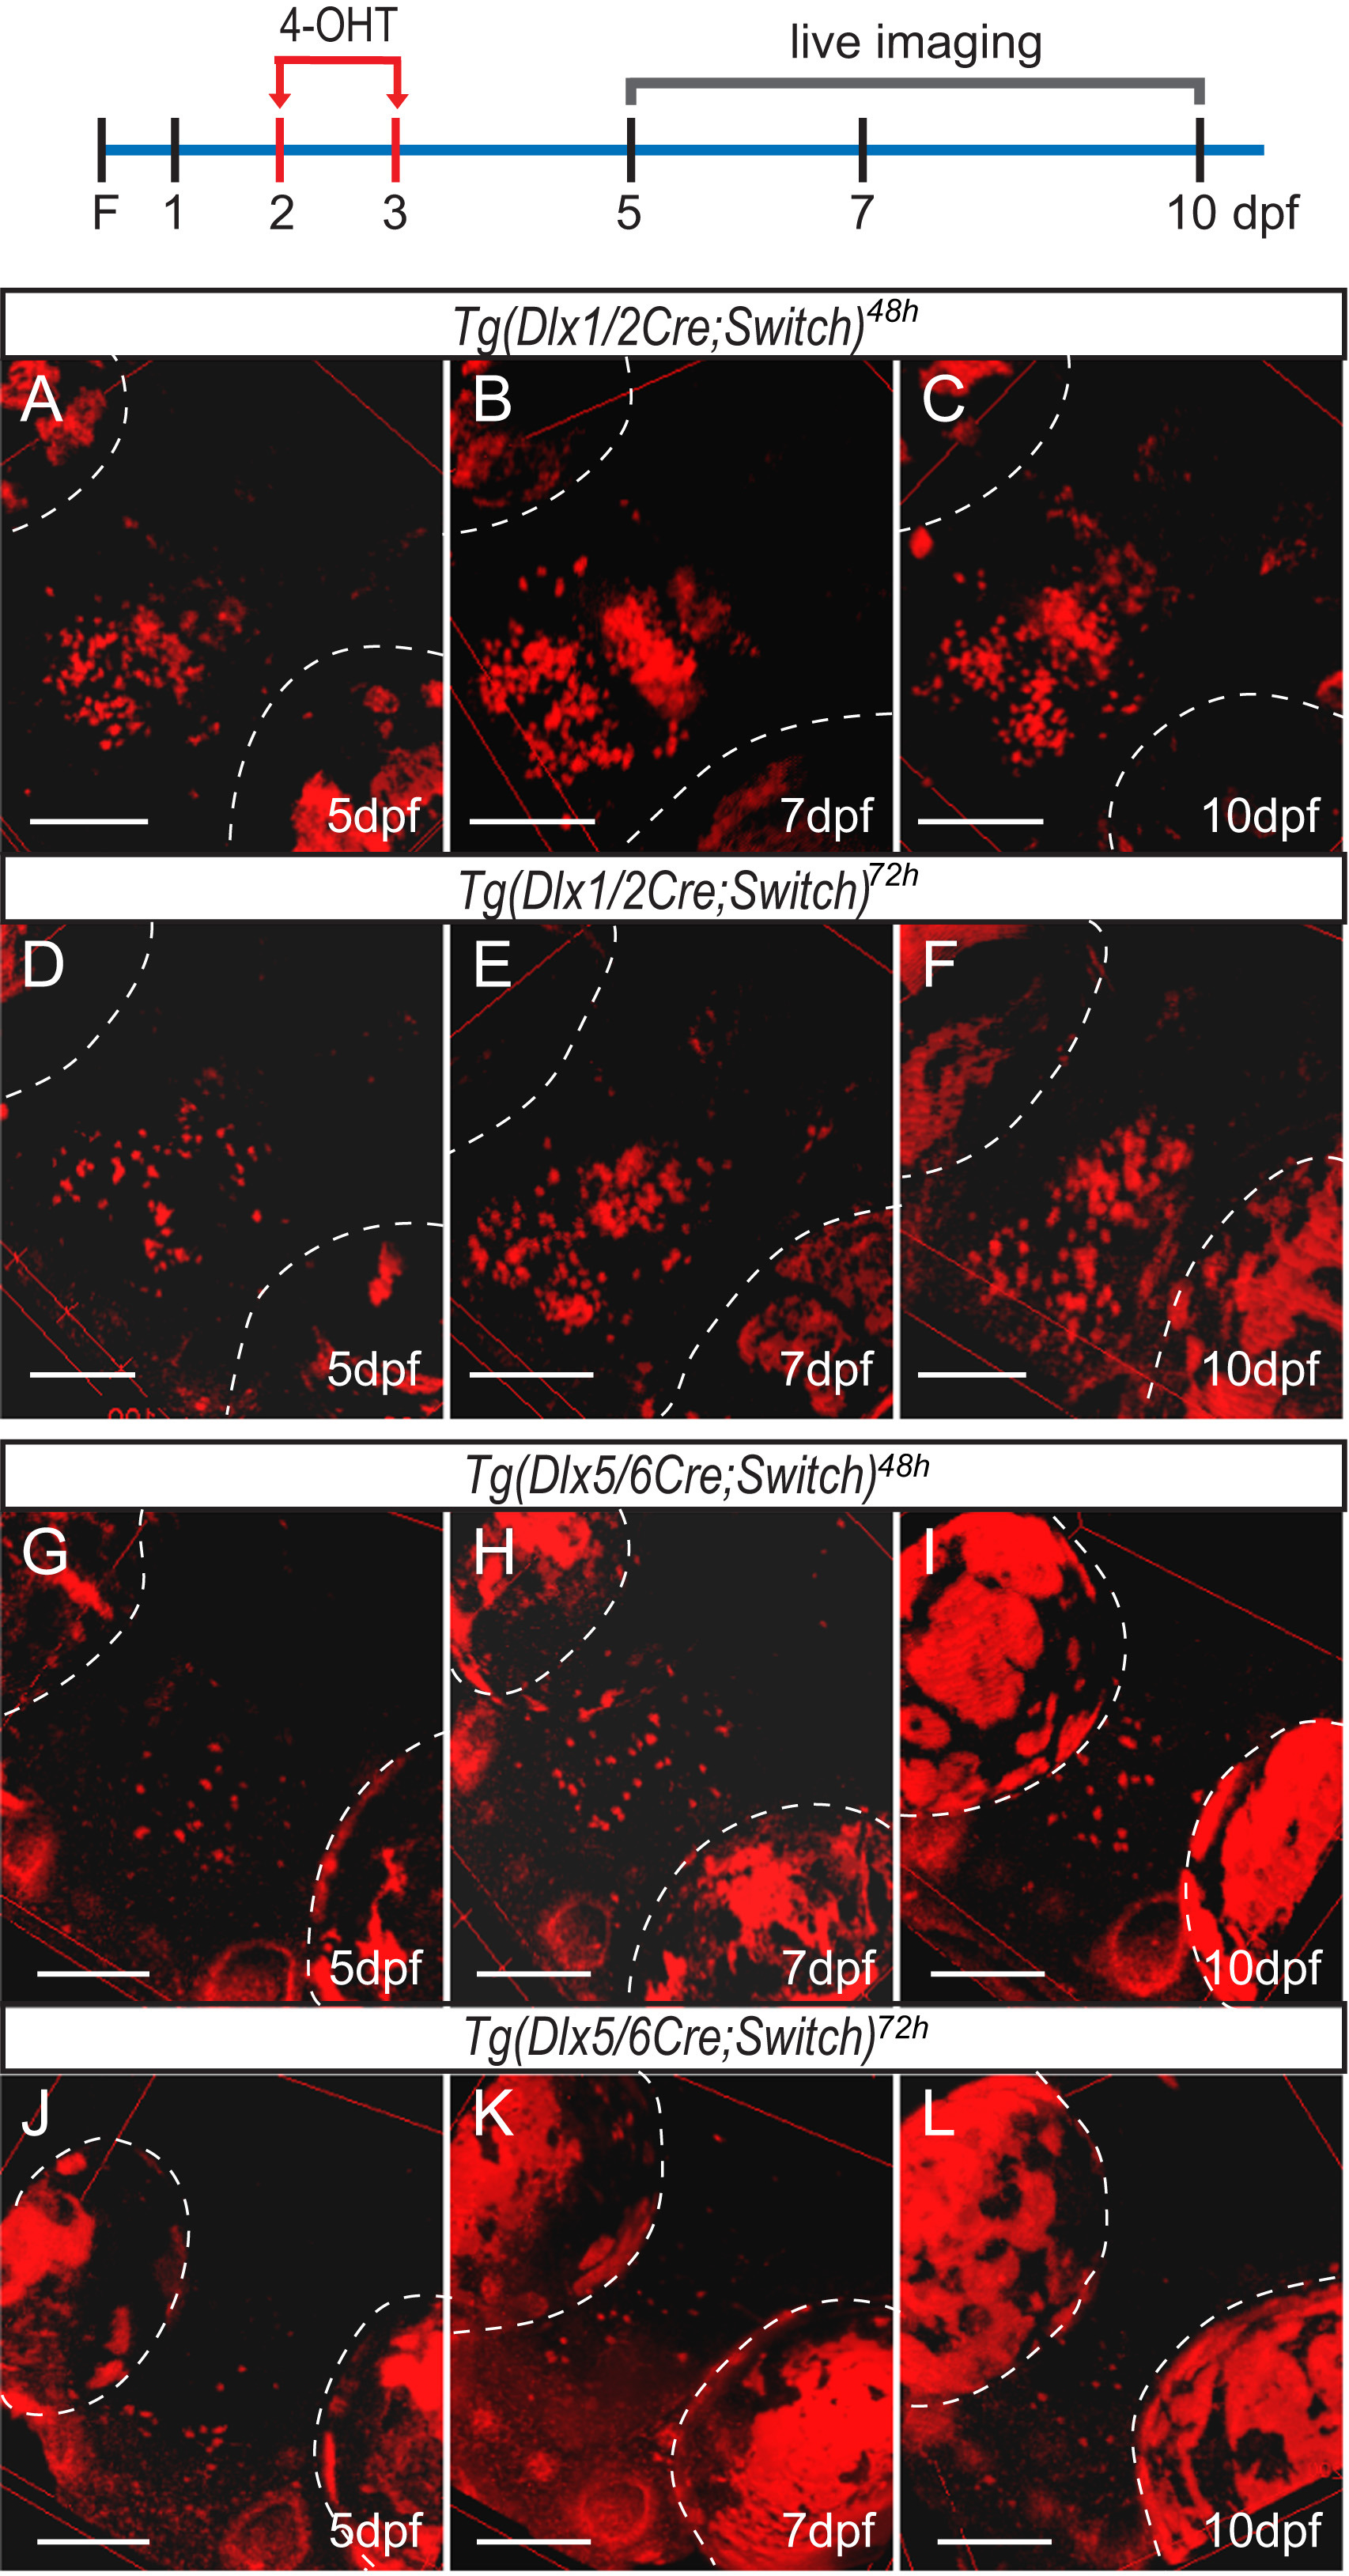
Fig. 3
Lineage tracing of dlx1a/2a and dlx5a/6a expressing cells by live confocal imaging of double transgenic fish induced with 4-OHT at 48 hpf and 72 hpf. The diagram illustrates induction with 4-OHT (red arrows) at 2 dpf and 3 dpf and the days on which the fish were imaged as shown below. (A-C) Tg(dlx1/2Cre;Switch)48h embryos imaged at 5 dpf (A, n=11), 7 dpf (B, n=7) and 10 dpf (C, n=7). (D-F) Tg(dlx1/2Cre;Switch)72h embryos imaged at 5 dpf (D, n=5), 7 dpf (E, n=13) and 10 dpf (F, n=10). (G-I) Tg(dlx5/6Cre;Switch)48h embryos imaged at 5 dpf (G, n=12), 7 dpf (H, n=10) and 10 dpf (I, n=12). (J-L) Tg(dlx5/6Cre;Switch)72h embryos imaged at 5 dpf (J, n=19), 7 dpf (K, n=18) and 10 dpf (L, n=15). The auto-fluorescence of the pigment cells in the eyes is outlined in white dotted lines. All fish are oriented with the rostral end at the bottom left as in Fig. 2. Scale bar: 100 µm.
Reprinted from Developmental Biology, 427(1), Solek, C.M., Feng, S., Perin, S., Weinschutz Mendes, H.C., Ekker, M., Lineage tracing of dlx1a/2a and dlx5a/6a expressing cells in the developing zebrafish brain, 131-147, Copyright (2017) with permission from Elsevier. Full text @ Dev. Biol.