
|
Fig. S2
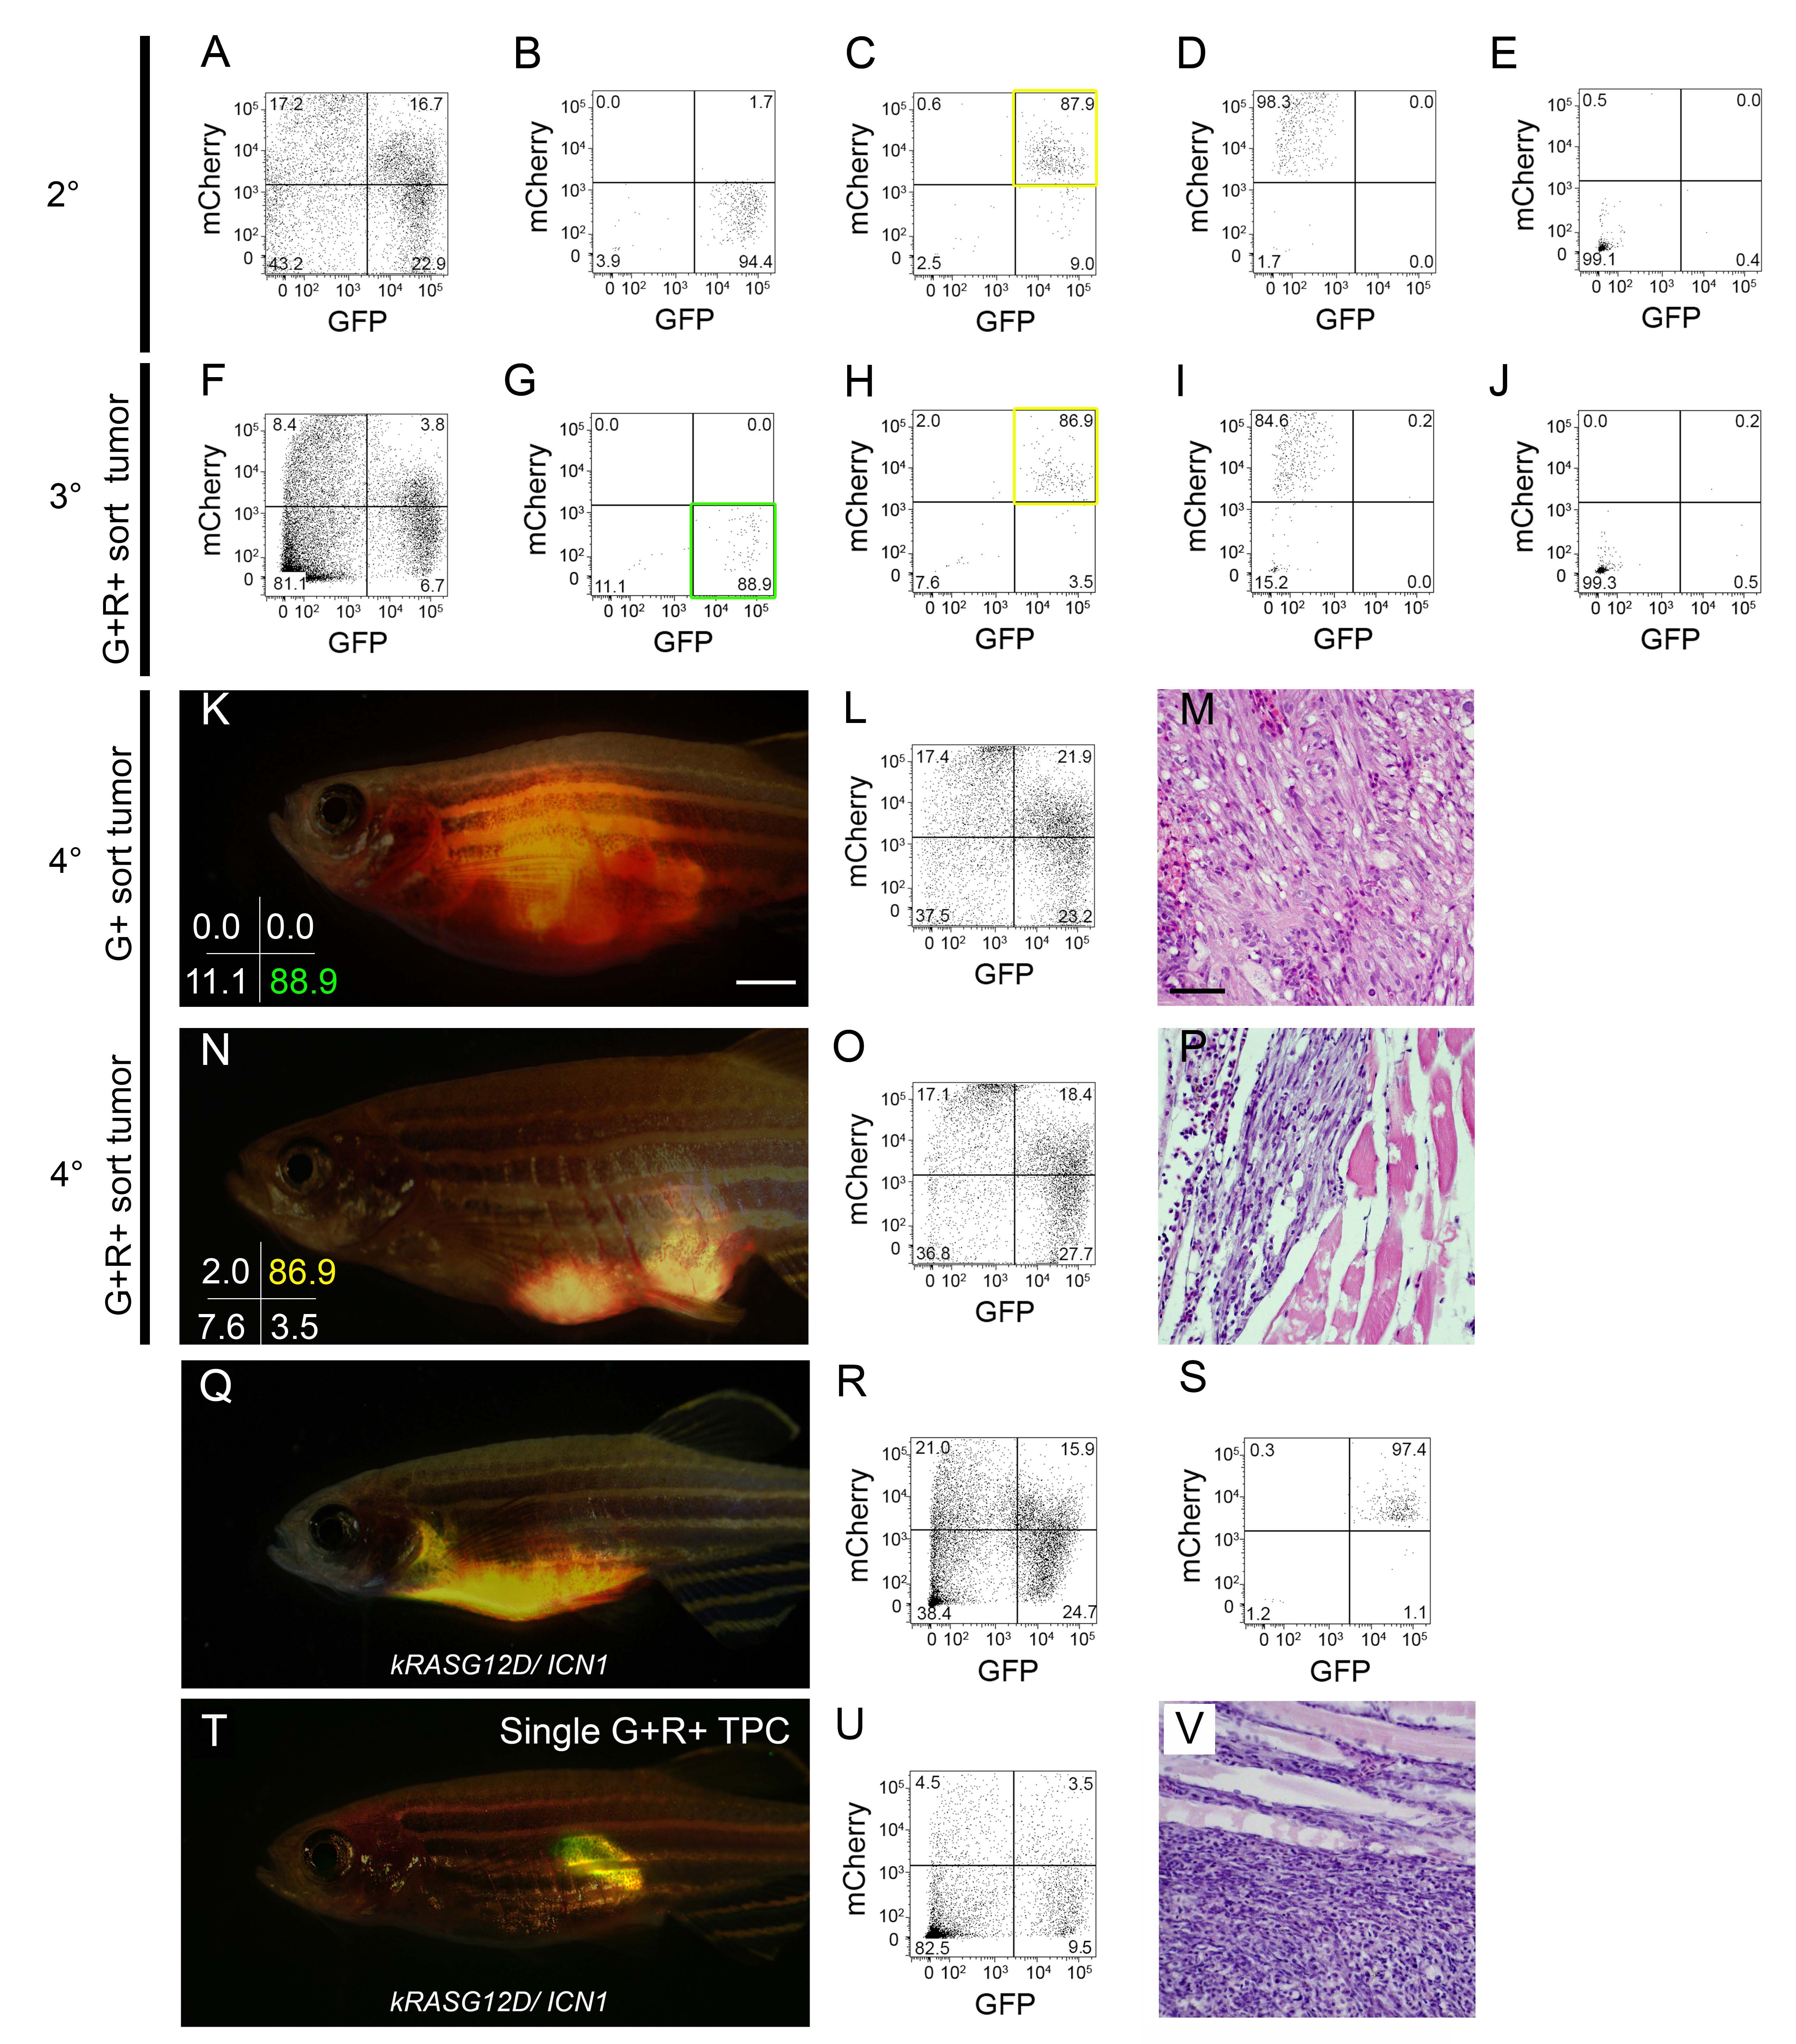
The double positive myf5-GFP+/mylz2-mCherrry+ ICN1-expressing ERMS cells generate tumors when engrafted into syngeneic CG1-strain recipient fish. Related to Figure 2.
(A-E) FACS plots of kRASG12D + ICN1-expressing ERMS (A) and following sorting of purified ERMS cell subfractions. These data show sort purity for experiments in Figure 2 B, E and Table S2. (F-J) FACS plots of tertiary transplanted ERMS (F) and following sorting of purified ERMS cell subfractions (G-J). (K-P) Representative animals serially transplanted with FACS sorted myf5-GFP+/mylz2-mCherry-negative ICN1-expressing ERMS cells (K-M, 1x10³ cells engrafted/fish) or myf5-GFP+/mylz2-mCherrry+ cells (N-P, 1x10³ cells engrafted/fish). Whole animal fluorescent images of engrafted fish with sort purity of transplanted tumor cells denoted in the lower left panel (K, N). Analysis of engrafted cell subfractions by FACs (L, O) or hematoxylin and eosin stained sections (M, P). (Q-V) Engraftment of highly purified double-positive myf5-GFP+/mylz2-mCherry+ ERMS cells verified acquisition of self-renewal and the ability to dedifferentiate into myf5-GFP+ alone expressing cells. myf5-GFP+/mylz2-mCherry+ ERMS cells were isolated from transplanted fish and enriched following three rounds of FACS (Q-S). Single TPC equivalents were injected into CG1 recipient fish (T). Engrafted tumors were analyzed by FACS (U) and histology (V). Scale bar in K, N, Q and T equals 2mm; M, P, and V equals 50μm.