
|
Fig. 2
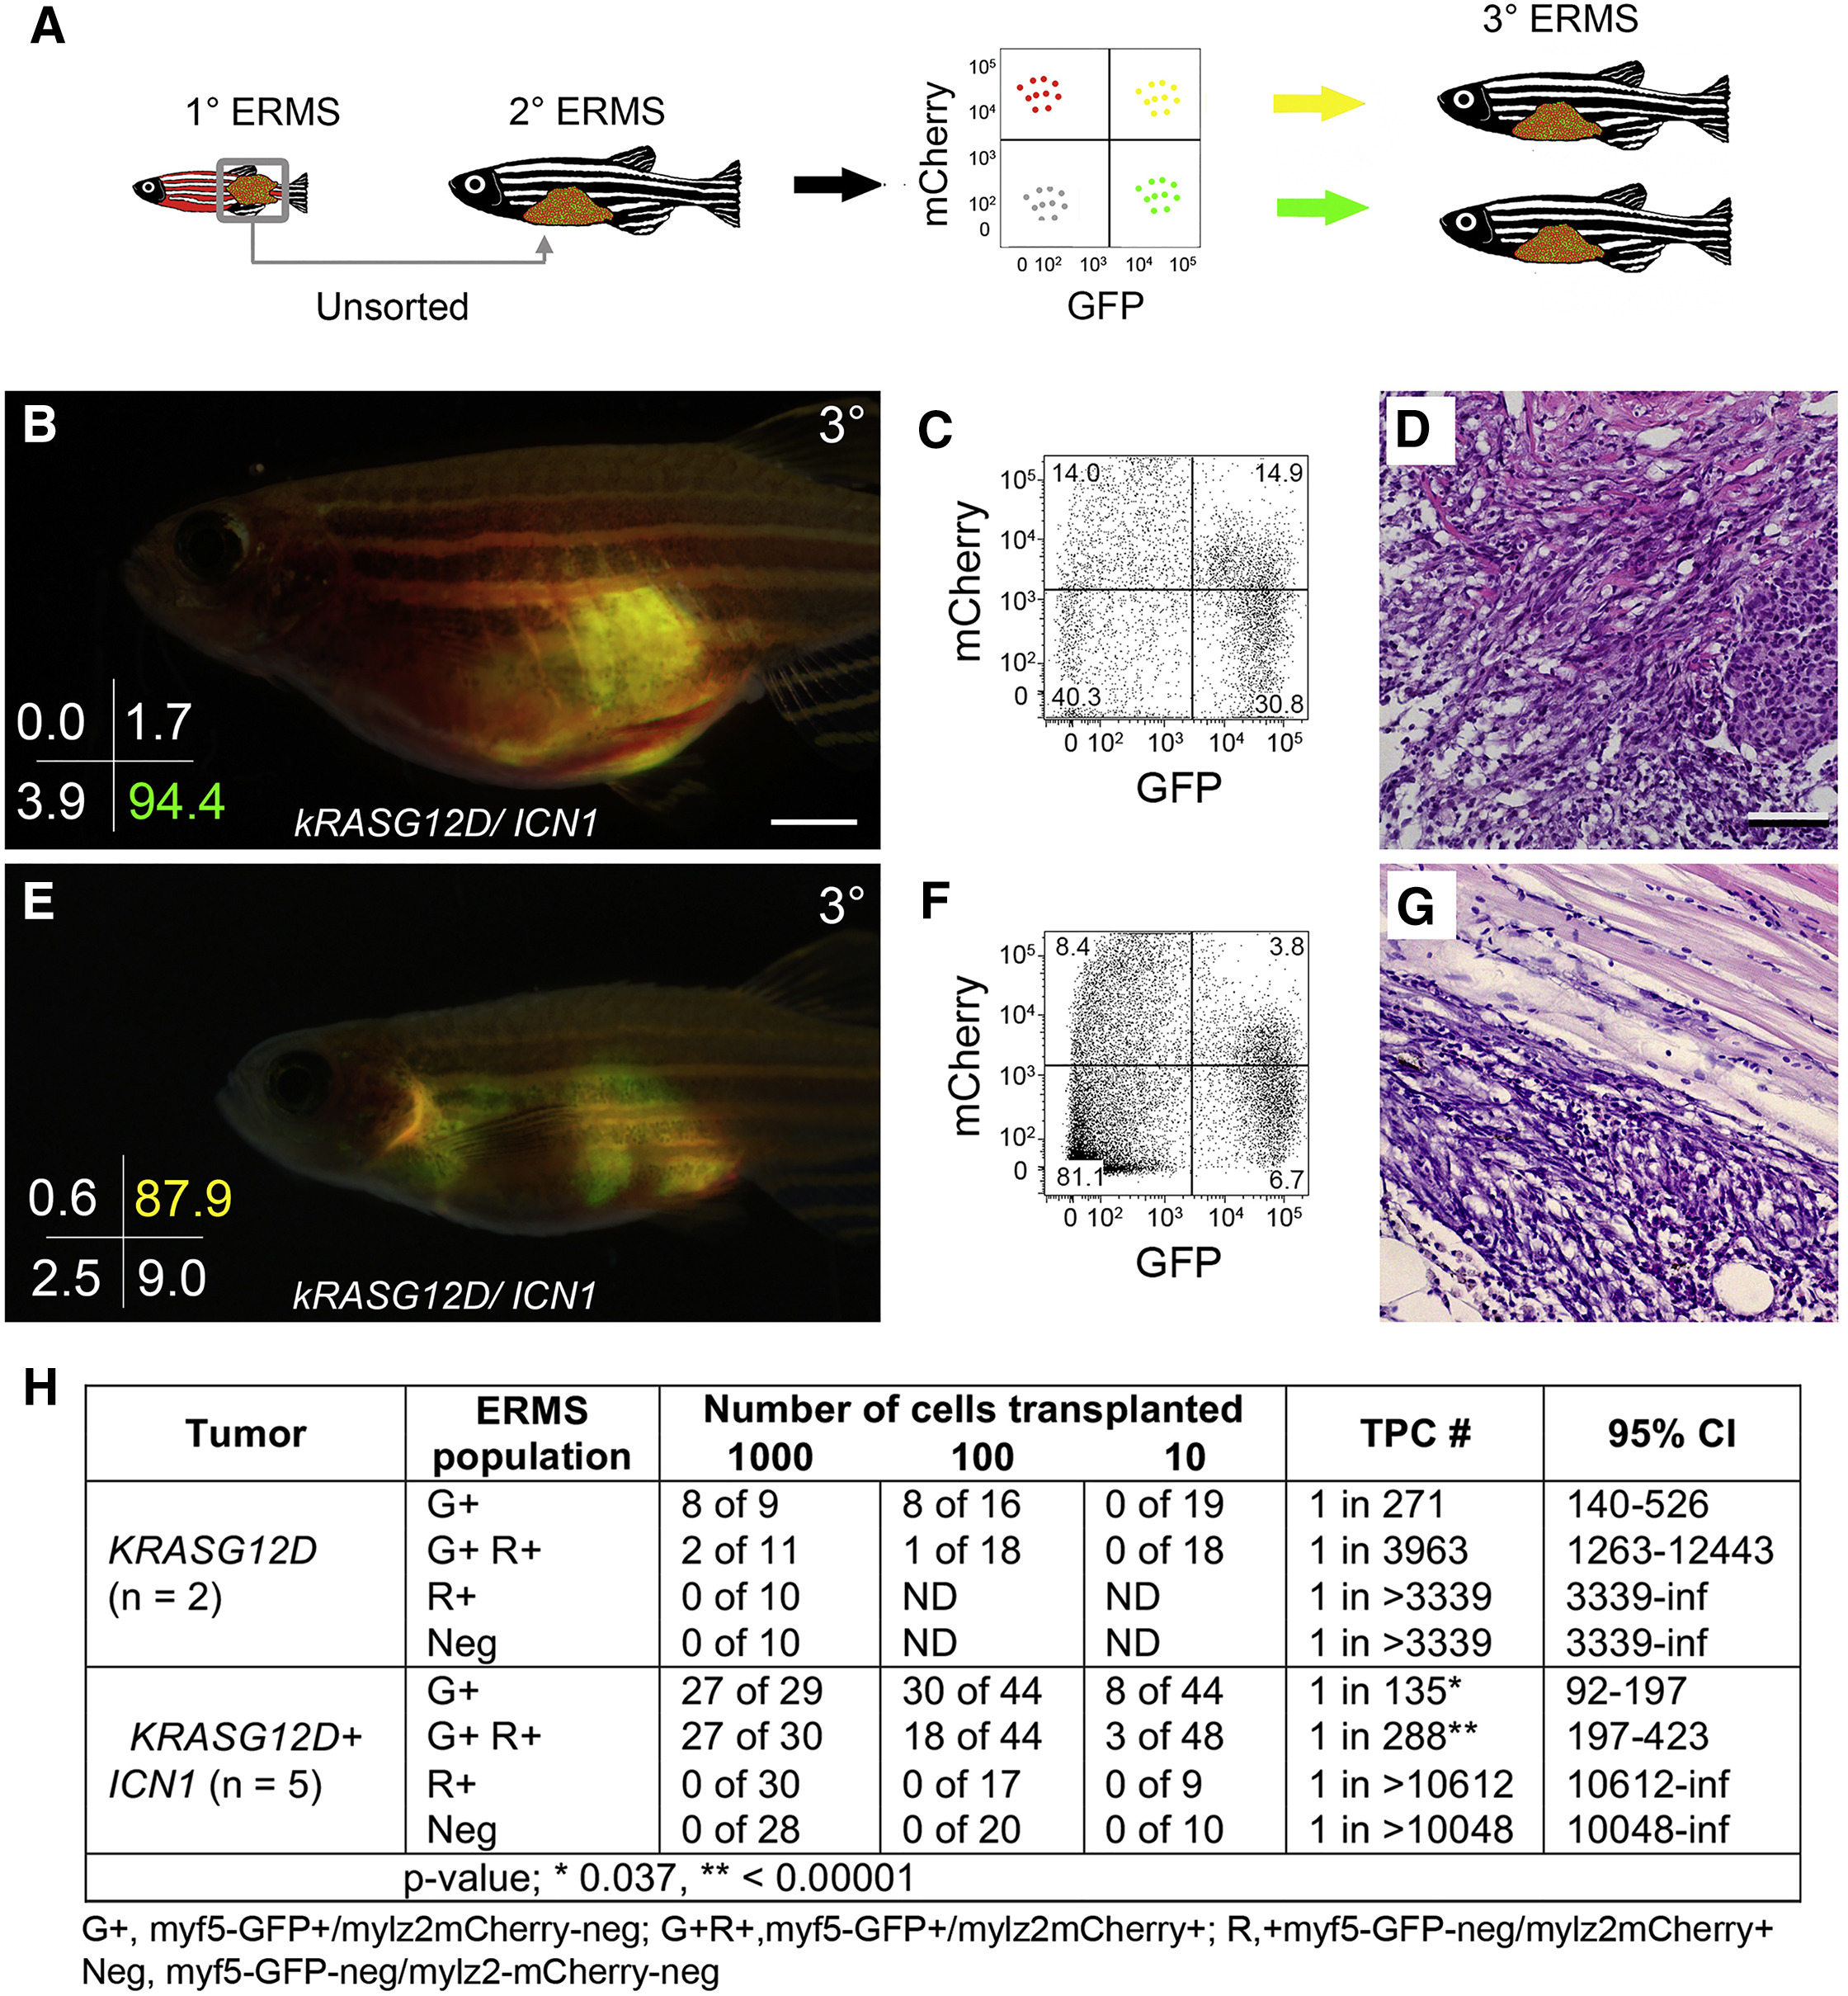
Notch1 Pathway Activation Confers Tumor-Propagating Activity to Differentiated ERMS Cells
(A) Schematic of limiting dilution cell transplantation assay used to assess engraftment potential of fluorescently labeled ERMS cell fractions.
(B–D) Engraftment with FACS-sorted myf5-GFP+/mylz2-mCherry-negative cells. (B) Whole animal image, (C) engrafted tumor cells analyzed by FACS, and (D) histology. Sort purity is denoted in the lower left corner of (B).
(E–G) Engraftment with FACS-sorted double-positive myf5-GFP+/mylz2-mCherry+ differentiated cells. (E) Whole animal image, (F) engrafted tumor cells analyzed by FACS, and (G) histology. Sort purity denoted in lower left corner of (E).
(H) Table showing combined analysis of engraftment rates for myf5-GFP+/mylz2-mCherry-negative, double-positive myf5-GFP+/mylz2-mCherry+, myf5-GFP-negative/mylz2-mCherry+, and double-negative cells. Number of tumors analyzed per condition is noted. ND, not determined; CI, confidence interval; inf, infinity.
Scale bar in (B), also pertaining to (E), 2 mm; scale bar in (D), also pertaining to (G), 50 μm.
See also Figure S2, Table S2, and Table S3.